Start here
Matplotlib basics
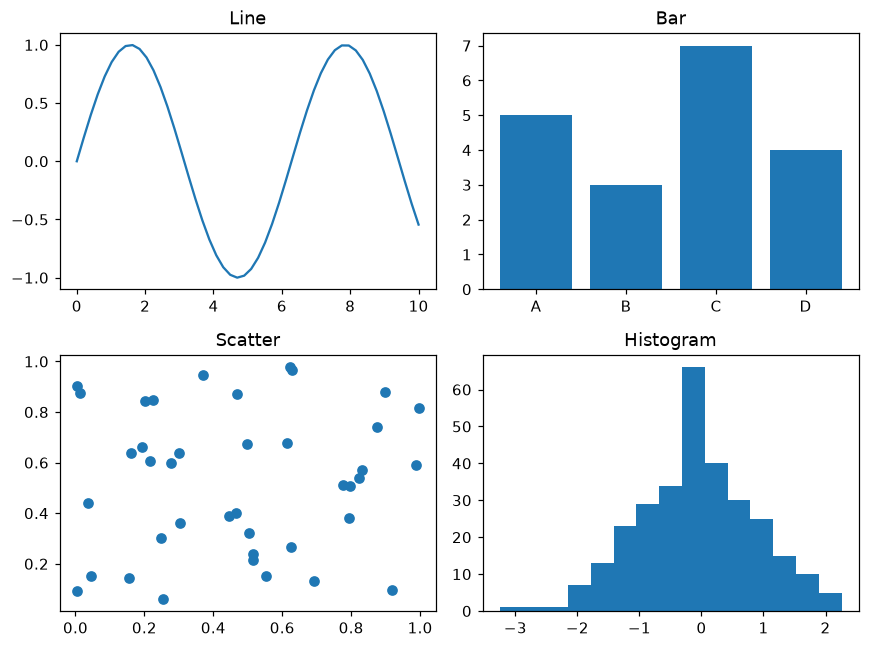
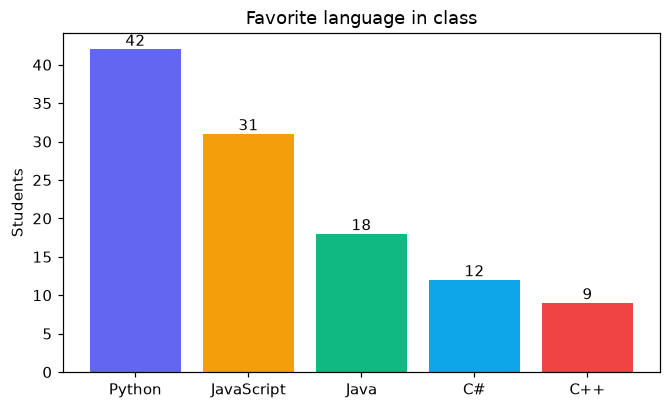
Draw your first charts with pyplot, add labels, legends, colors and several charts in one figure, and learn the four everyday chart types.
- 9 lessons
- About 2 h

Short lessons on drawing charts in Python. Each lesson has a live visualizer you can play with, the code behind it, and a button to run it online.
Follow a path: short lessons first, then a challenge to check you can use the idea on your own.
Draw your first charts with pyplot, add labels, legends, colors and several charts in one figure, and learn the four everyday chart types.
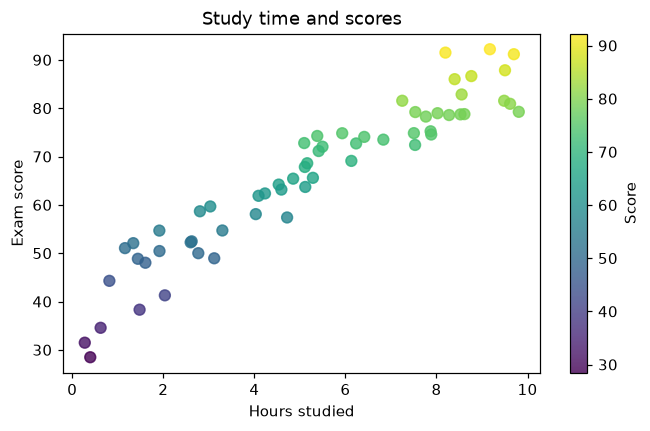
Control axes and ticks, annotate what matters, show spread and uncertainty, stack data, plot pandas DataFrames and save figures for reports.
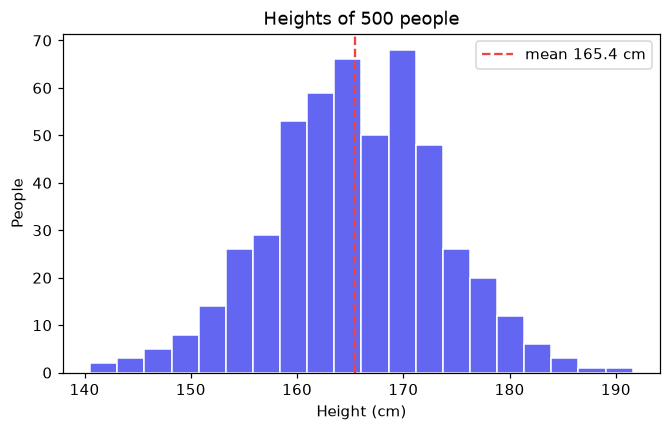
Heatmaps, two y axes, complex layouts, 3D surfaces and animations, finishing with a sales dashboard project.
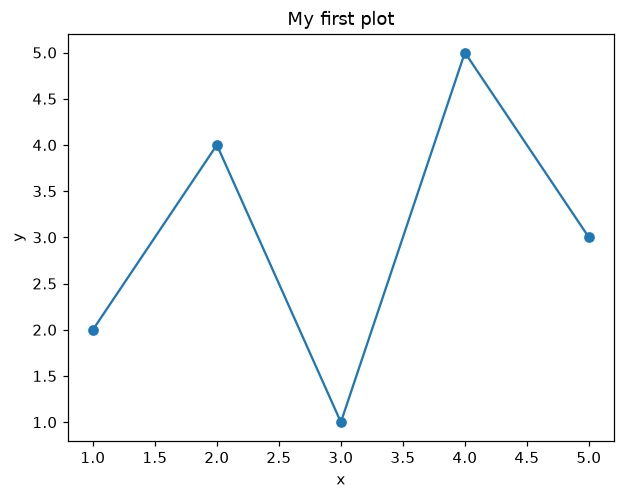
Plot a graph in Python in a few lines with matplotlib.pyplot: plt.plot, plt.title, plt.xlabel and plt.show.
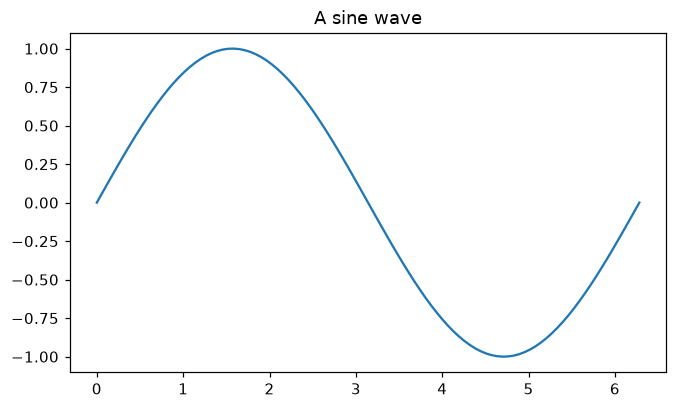
View lesson →Draw a smooth line graph from NumPy data with plt.subplots and ax.plot.
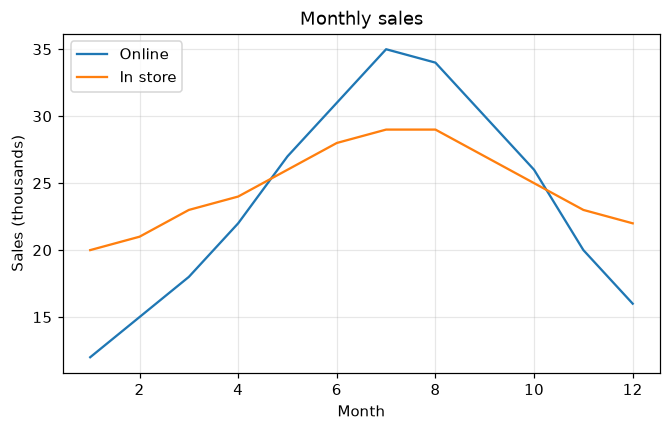
View lesson →Explain a chart with a title, axis labels, a legend and a grid.
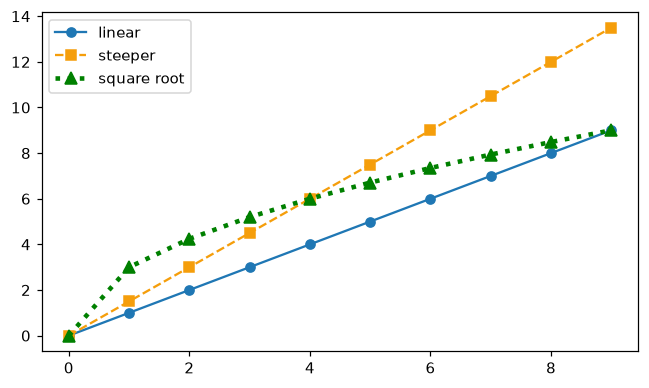
View lesson →Change the color, line style, line width and markers of each line.
View lesson →Arrange a grid of charts with plt.subplots(rows, columns).
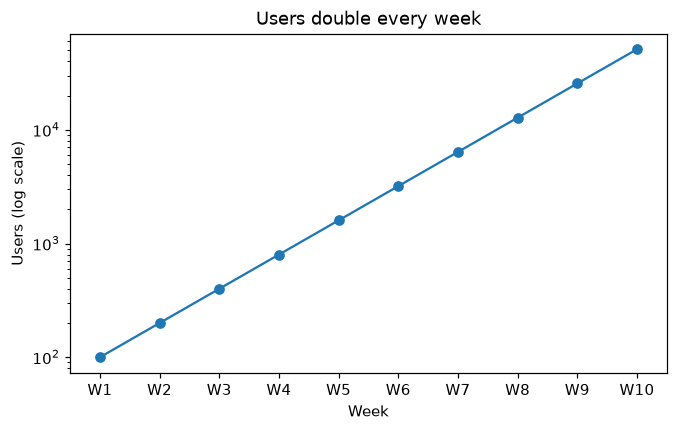
View lesson →Set axis limits, choose tick positions and labels, and switch to a log scale with set_yscale.
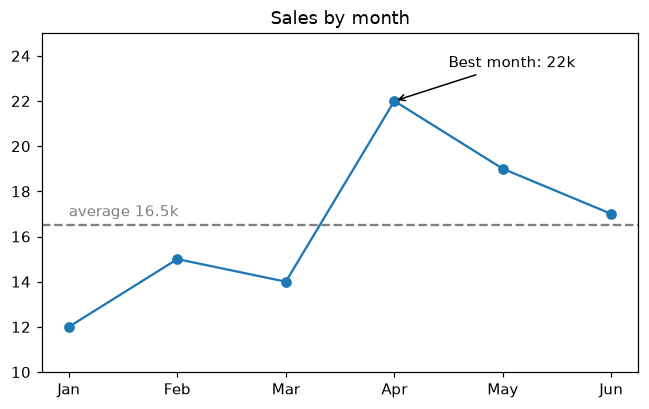
View lesson →Point at important values with ax.annotate, add notes with ax.text and mark targets with axhline.
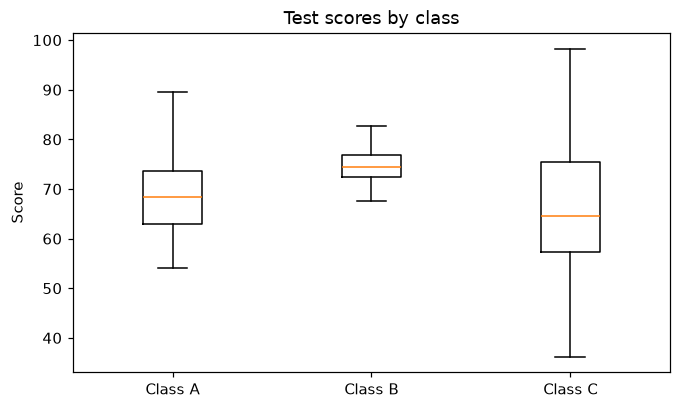
View lesson →Compare the spread of several groups with ax.boxplot and ax.violinplot.
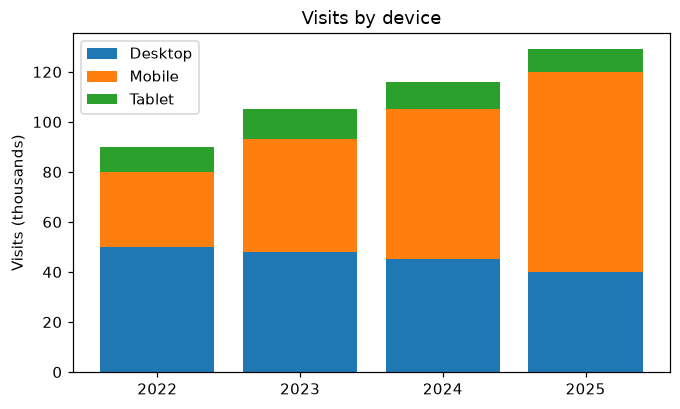
View lesson →Show how parts add up over time with stacked bars (bottom=) and ax.stackplot.
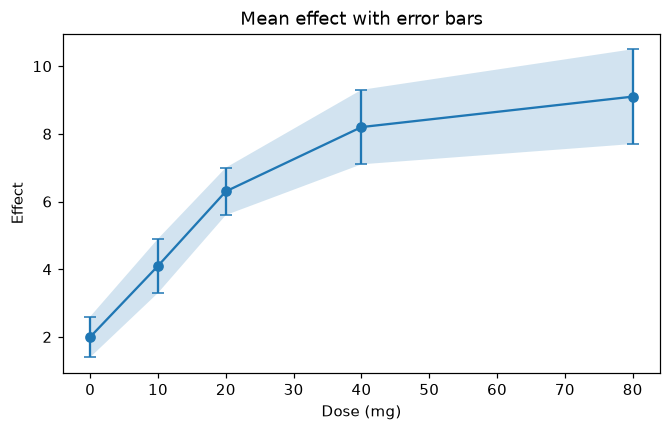
View lesson →Show measurement uncertainty with ax.errorbar and a shaded band with fill_between.
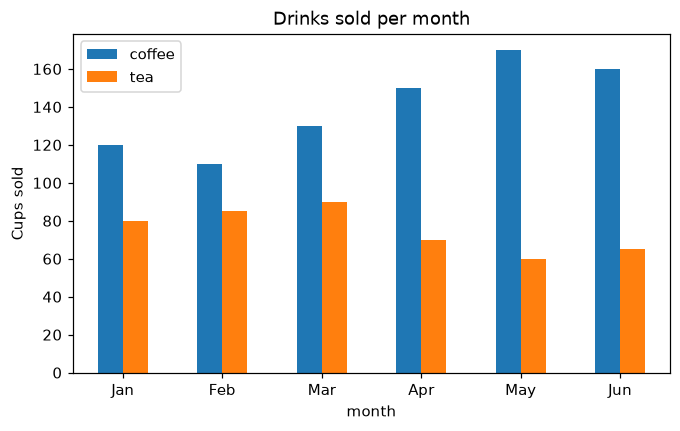
View lesson →Turn a pandas DataFrame into a chart with df.plot and customize it with Matplotlib.
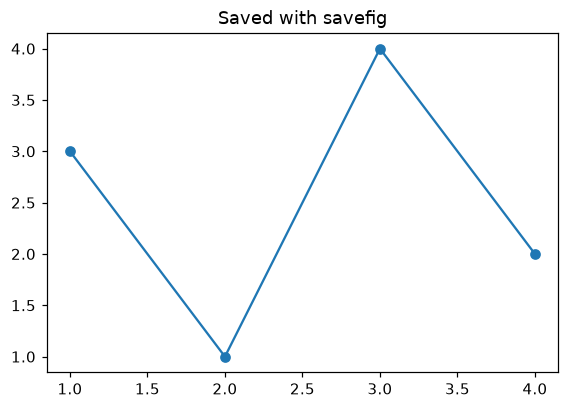
View lesson →Save charts as PNG or SVG with fig.savefig and control their size, resolution and margins.
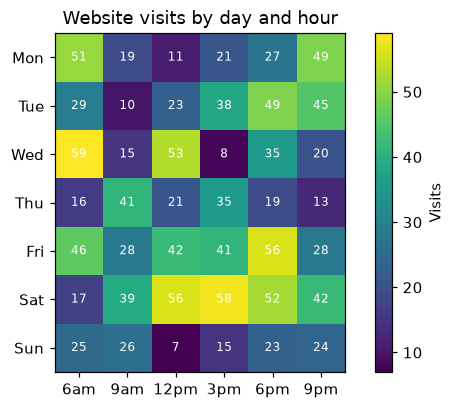
View lesson →Draw a heatmap of a 2D table with ax.imshow, a colormap, a colorbar and a value in each cell.
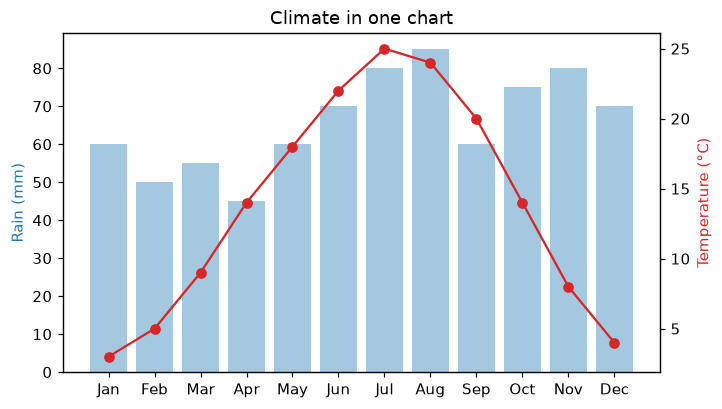
View lesson →Plot two measures with different units on one chart using a second y axis from ax.twinx.
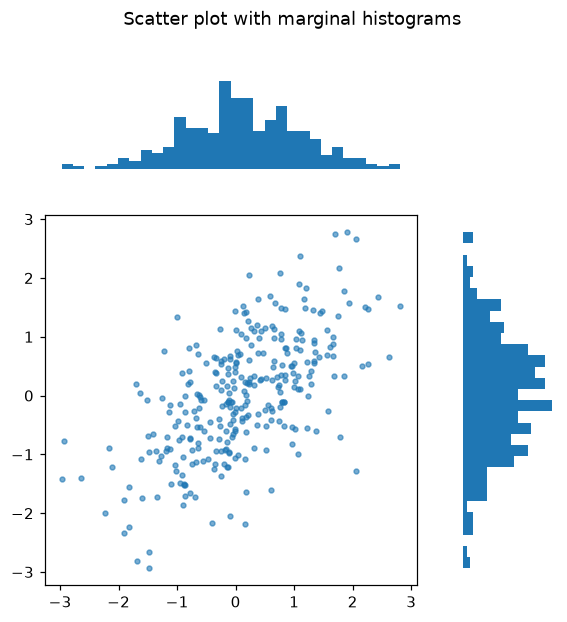
View lesson →Build figures with charts of different sizes using plt.subplot_mosaic and width and height ratios.
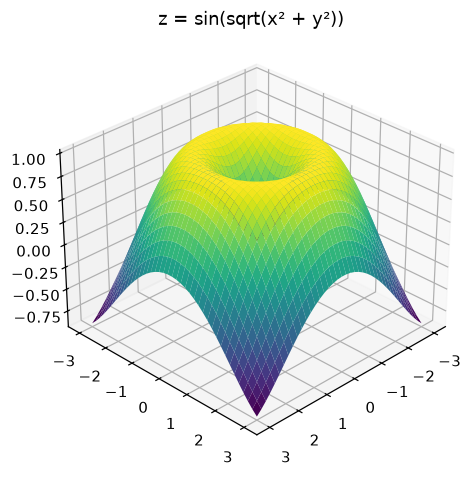
View lesson →Draw 3D surfaces and wireframes with projection="3d", plot_surface and view_init.
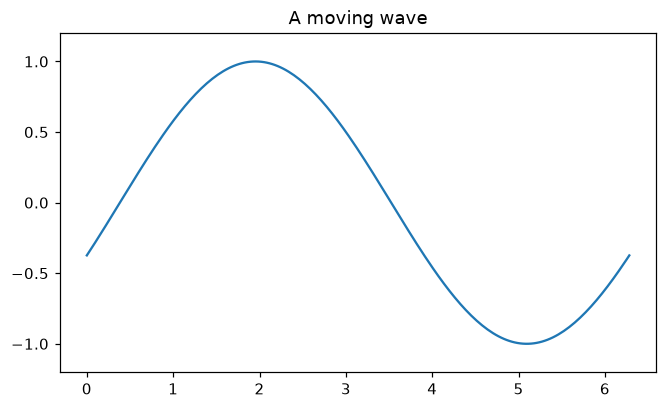
View lesson →Animate a chart frame by frame with FuncAnimation and save it as a GIF.
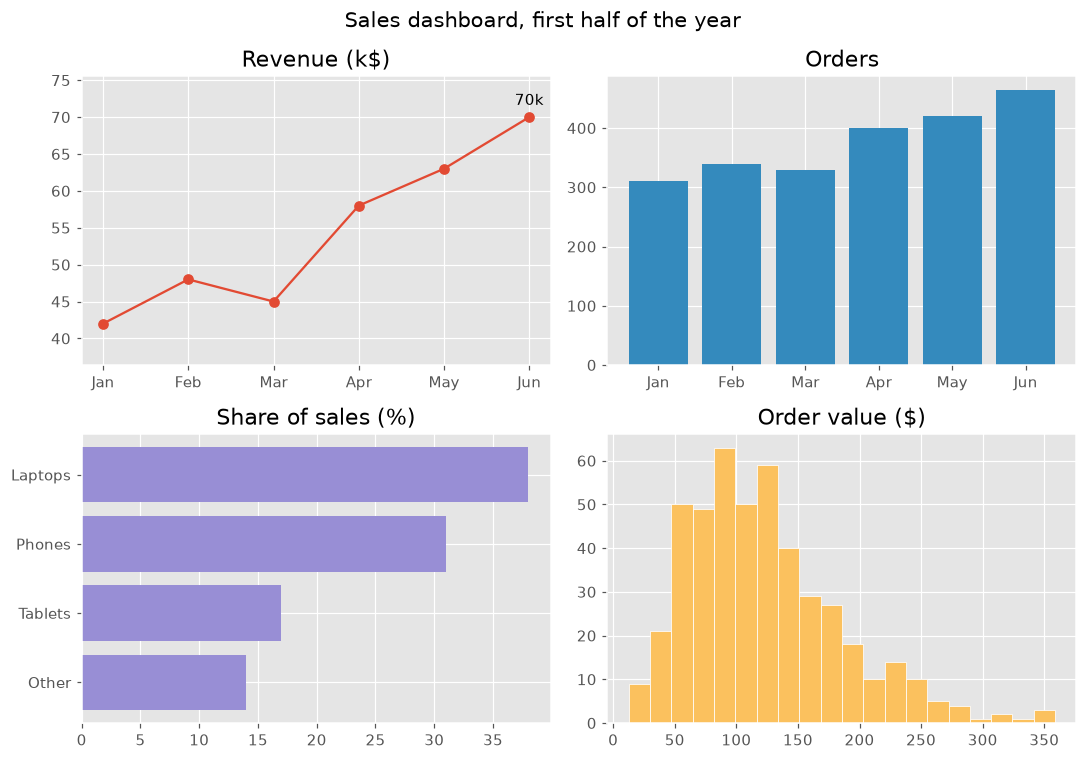
View lesson →Combine line, bar and histogram charts, annotations and a style into a 2 × 2 sales dashboard.
View lesson →