Plot a Line Graph in Python
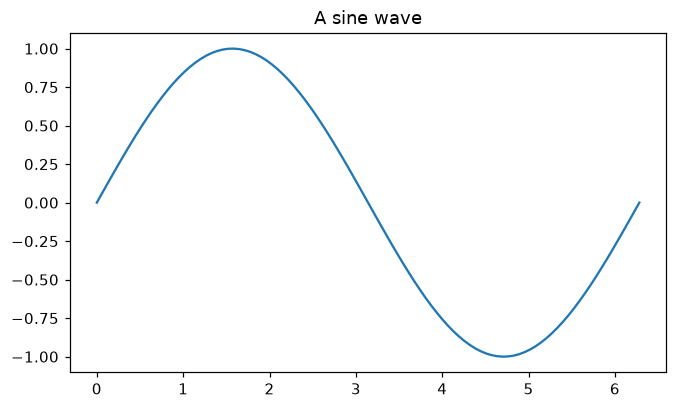
Draw a smooth line graph from NumPy data with plt.subplots and ax.plot.
Introduction
A Matplotlib chart lives in a Figure (the whole image) that holds one or more Axes (the plotting area). plt.subplots creates both, and ax.plot connects points with a line.
np.linspace makes 100 evenly spaced x values between 0 and 2π, and np.sin computes y for all of them at once. ax.plot draws the line through those points; more points make the curve smoother. plt.show displays the figure.
Interactive visualizer
Change the amplitude, frequency and number of points. With few points the curve turns into straight segments; that is how ax.plot works.
Runnable Matplotlib example
Matplotlib
main.py
import matplotlib.pyplot as plt
import numpy as np

x = np.linspace(0, 2 * np.pi, 100)
y = np.sin(x)

fig, ax = plt.subplots(figsize=(7, 4))
ax.plot(x, y)
ax.set_title("A sine wave")
plt.show()