Box Plots and Violin Plots
Compare the spread of several groups with ax.boxplot and ax.violinplot.
Introduction
A bar chart of averages hides how spread out the values are. A box plot shows the median, the middle half of the data (the box), the usual range (the whiskers) and outliers as dots. A violin plot shows the whole shape of each group.
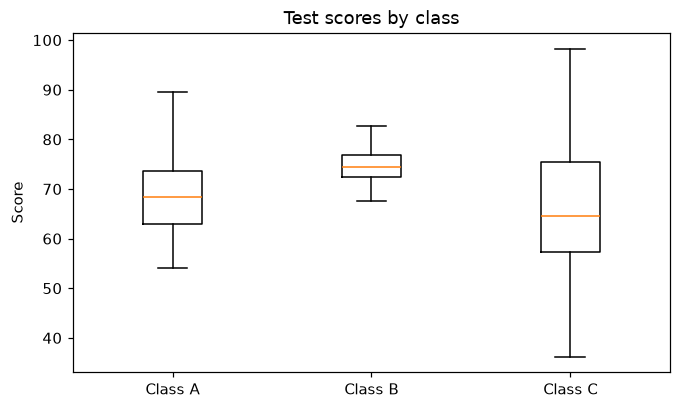
Each list in scores becomes one box. The line inside the box is the median, the box covers the middle 50% of the scores, and the whiskers reach the furthest values that are not outliers. Class B has a much smaller box than the others: its scores are close together. set_xticks names the boxes, which sit at x = 1, 2 and 3; ax.violinplot(scores) would draw the same groups as violins.
Interactive visualizer
Switch between a box plot and a violin plot, show every score as a dot, and change how spread out Class C is.
Runnable Matplotlib example
import matplotlib.pyplot as plt
import numpy as np

rng = np.random.default_rng(5)
scores = [rng.normal(70, 8, 80), rng.normal(75, 4, 80), rng.normal(65, 12, 80)]

fig, ax = plt.subplots(figsize=(7, 4))
ax.boxplot(scores)
ax.set_xticks([1, 2, 3], ["Class A", "Class B", "Class C"])
ax.set_ylabel("Score")
ax.set_title("Test scores by class")
plt.show()