Colors, Line Styles, and Markers
Change the color, line style, line width and markers of each line.
Introduction
Styles make lines easy to tell apart, even when printed in black and white. Every ax.plot call accepts color, linestyle, linewidth and marker.
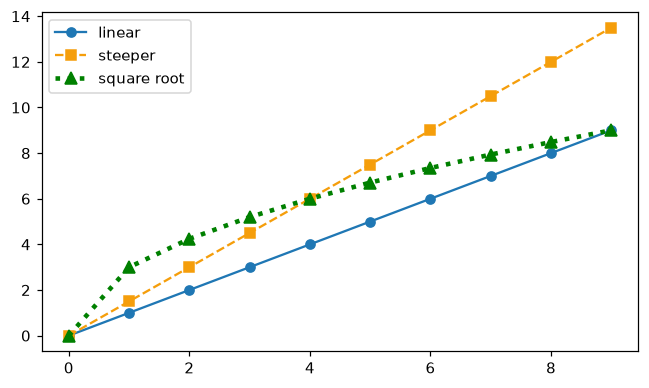
color takes a name or a hex code. linestyle can be "-" (solid), "--" (dashed), ":" (dotted) or "-.". marker draws a symbol at each data point, such as "o" (circle), "s" (square) or "^" (triangle), and markersize sets its size.
Interactive visualizer
Try colors, line styles and markers. The highlighted line of code changes with every choice.
Runnable Matplotlib example
Matplotlib
main.py
import matplotlib.pyplot as plt
import numpy as np

x = np.arange(0, 10)

fig, ax = plt.subplots(figsize=(7, 4))
ax.plot(x, x, color="tab:blue", linestyle="-", marker="o", label="linear")
ax.plot(x, x * 1.5, color="#f59e0b", linestyle="--", marker="s", label="steeper")
ax.plot(x, np.sqrt(x) * 3, color="green", linestyle=":", linewidth=3, marker="^", markersize=8, label="square root")
ax.legend()
plt.show()