Stacked Bars and Area Charts
Show how parts add up over time with stacked bars (bottom=) and ax.stackplot.
Introduction
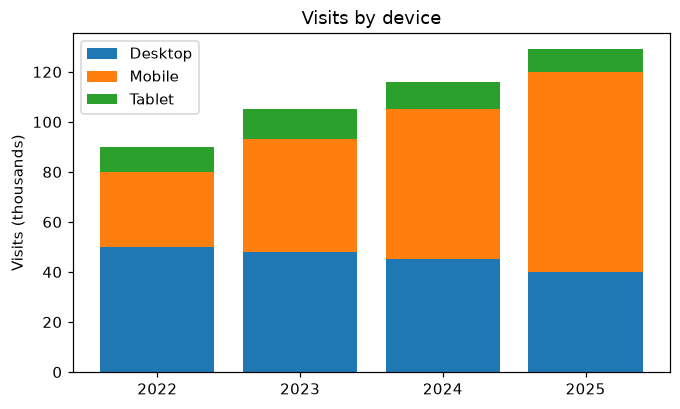
When several series add up to a total, stack them. Each bar starts where the previous one ended, so the full height is the total and each colored part is one series. ax.stackplot does the same with filled areas.
bottom= tells each ax.bar call where its bars start: mobile starts on top of desktop, and tablet on top of both. Using NumPy arrays makes desktop + mobile add the values year by year. The total height of each bar is all visits that year, and the legend tells the parts apart.
Interactive visualizer
Compare stacked bars, grouped bars and an area chart, and switch to percentages to see each device's share.
Runnable Matplotlib example
Matplotlib
main.py
import matplotlib.pyplot as plt
import numpy as np

years = ["2022", "2023", "2024", "2025"]
desktop = np.array([50, 48, 45, 40])
mobile = np.array([30, 45, 60, 80])
tablet = np.array([10, 12, 11, 9])

fig, ax = plt.subplots(figsize=(7, 4))
ax.bar(years, desktop, label="Desktop")
ax.bar(years, mobile, bottom=desktop, label="Mobile")
ax.bar(years, tablet, bottom=desktop + mobile, label="Tablet")
ax.set_ylabel("Visits (thousands)")
ax.set_title("Visits by device")
ax.legend()
plt.show()