Titles, Labels, and Legends
Explain a chart with a title, axis labels, a legend and a grid.
Introduction
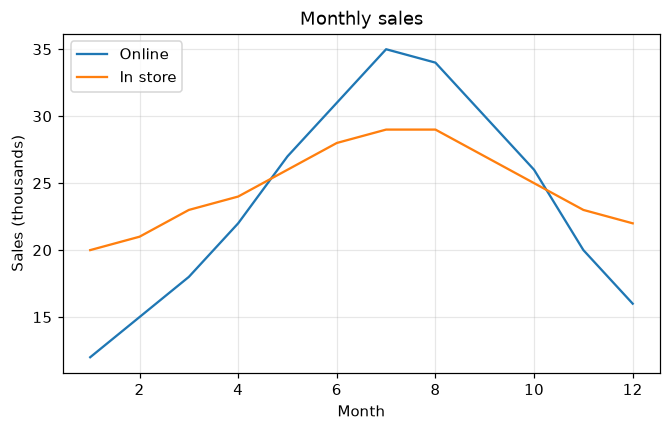
A chart is only useful when readers know what it shows. Give every line a label, then add axis labels, a title and a legend that matches each line to its label.
label= names each line, and ax.legend shows those names in a box; loc chooses where it goes. set_xlabel and set_ylabel describe the axes, and ax.grid adds light guide lines (alpha makes them faint).
Interactive visualizer
Turn each part on and off to see what a chart looks like without it, and move the legend to a corner where it hides no data.
Runnable Matplotlib example
Matplotlib
main.py
import matplotlib.pyplot as plt
import numpy as np

months = np.arange(1, 13)
online = [12, 15, 18, 22, 27, 31, 35, 34, 30, 26, 20, 16]
store = [20, 21, 23, 24, 26, 28, 29, 29, 27, 25, 23, 22]

fig, ax = plt.subplots(figsize=(7, 4))
ax.plot(months, online, label="Online")
ax.plot(months, store, label="In store")
ax.set_title("Monthly sales")
ax.set_xlabel("Month")
ax.set_ylabel("Sales (thousands)")
ax.legend(loc="upper left")
ax.grid(True, alpha=0.3)
plt.show()