Heatmaps with imshow and Colormaps
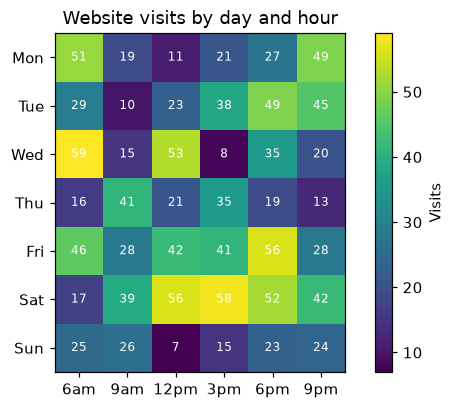
Draw a heatmap of a 2D table with ax.imshow, a colormap, a colorbar and a value in each cell.
Introduction
A heatmap colors each cell of a table by its value, so patterns in rows and columns jump out. ax.imshow draws a 2D array as colored cells, the colormap (cmap) turns numbers into colors and fig.colorbar shows the scale.
visits is a 7 × 6 array: one row per day and one column per time of day. imshow draws row 0 at the top, and set_xticks / set_yticks name the columns and rows. The double loop writes each value in its cell with ax.text(column, row, ...). Sequential colormaps like viridis suit values from low to high; diverging ones like coolwarm suit values above and below a middle.
Interactive visualizer
Try other colormaps, hide the numbers and the colorbar. A good colormap makes high and low values easy to tell apart.
Runnable Matplotlib example
import matplotlib.pyplot as plt
import numpy as np

days = ["Mon", "Tue", "Wed", "Thu", "Fri", "Sat", "Sun"]
hours = ["6am", "9am", "12pm", "3pm", "6pm", "9pm"]
rng = np.random.default_rng(2)
visits = rng.integers(5, 60, size=(len(days), len(hours)))

fig, ax = plt.subplots(figsize=(7, 4))
image = ax.imshow(visits, cmap="viridis")
ax.set_xticks(range(len(hours)), hours)
ax.set_yticks(range(len(days)), days)
for row in range(len(days)):
    for col in range(len(hours)):
        ax.text(col, row, visits[row, col], ha="center", va="center", color="white", fontsize=8)
fig.colorbar(image, label="Visits")
ax.set_title("Website visits by day and hour")
plt.show()