Two Y Axes with twinx
Plot two measures with different units on one chart using a second y axis from ax.twinx.
Introduction
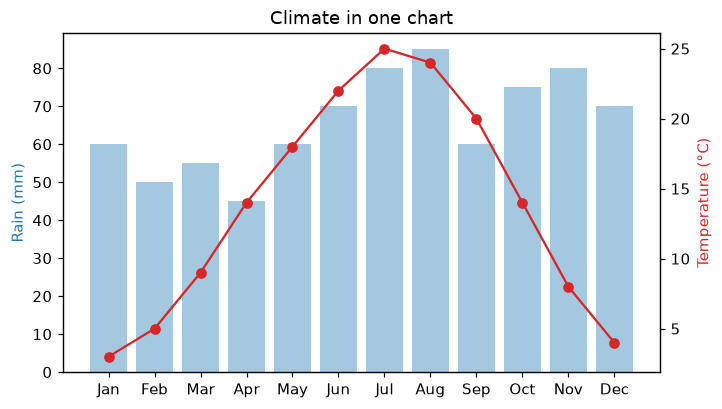
Rain in millimeters and temperature in degrees do not share a scale: on one axis, one of them looks flat. ax.twinx creates a second Axes that shares the x axis but has its own y axis on the right.
ax1 draws the rain bars with its y axis on the left. ax2 = ax1.twinx() shares the months but gets a new y axis on the right for temperature. Coloring each axis label like its data tells the reader which axis belongs to which series. Use two axes sparingly: readers can misread how the two series compare.
Interactive visualizer
Turn the second y axis off to see why it helps: on one shared scale the temperature line is squashed at the bottom.
Runnable Matplotlib example
Matplotlib
main.py
import matplotlib.pyplot as plt

months = ["Jan", "Feb", "Mar", "Apr", "May", "Jun", "Jul", "Aug", "Sep", "Oct", "Nov", "Dec"]
temperature = [3, 5, 9, 14, 18, 22, 25, 24, 20, 14, 8, 4]
rain = [60, 50, 55, 45, 60, 70, 80, 85, 60, 75, 80, 70]

fig, ax1 = plt.subplots(figsize=(7, 4))
ax1.bar(months, rain, color="tab:blue", alpha=0.4)
ax1.set_ylabel("Rain (mm)", color="tab:blue")

ax2 = ax1.twinx()
ax2.plot(months, temperature, color="tab:red", marker="o")
ax2.set_ylabel("Temperature (°C)", color="tab:red")
ax1.set_title("Climate in one chart")
plt.show()