3D Surface Plots
Draw 3D surfaces and wireframes with projection="3d", plot_surface and view_init.
Introduction
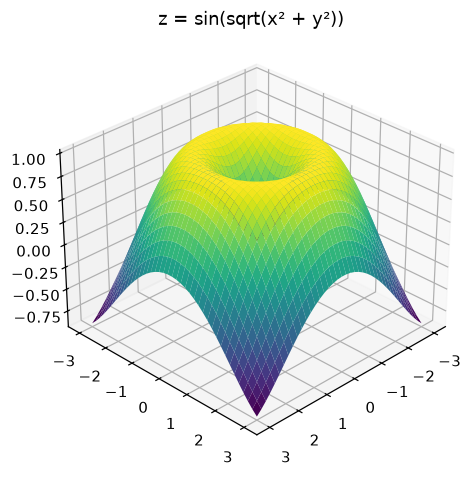
Some data depends on two inputs, like a height that depends on x and y. A 3D Axes, created with projection="3d", can draw it as a surface. view_init turns the camera so you can look at it from the best angle.
np.meshgrid turns the two 1D ranges into 2D grids X and Y, so Z can be computed for every (x, y) pair at once. plot_surface colors the surface with a colormap; plot_wireframe would draw only the grid lines. view_init(elev, azim) sets the camera: elev is the height angle and azim turns around the vertical axis.
Interactive visualizer
Turn the camera with elev and azim, switch between a surface and a wireframe and try other functions.
Runnable Matplotlib example
Matplotlib
main.py
import matplotlib.pyplot as plt
import numpy as np

x = np.linspace(-3, 3, 40)
y = np.linspace(-3, 3, 40)
X, Y = np.meshgrid(x, y)
Z = np.sin(np.sqrt(X ** 2 + Y ** 2))

fig = plt.figure(figsize=(7, 5))
ax = fig.add_subplot(projection="3d")
ax.plot_surface(X, Y, Z, cmap="viridis")
ax.view_init(elev=30, azim=45)
ax.set_title("z = sin(sqrt(x² + y²))")
plt.show()