Matplotlib pyplot Basics: plt.plot and plt.show
Plot a graph in Python in a few lines with matplotlib.pyplot: plt.plot, plt.title, plt.xlabel and plt.show.
Introduction
matplotlib.pyplot, imported as plt, is the quickest way to plot a graph in Python. Each plt function adds one thing to the current chart: plt.plot draws the line, plt.title and plt.xlabel add text, and plt.show displays the result.
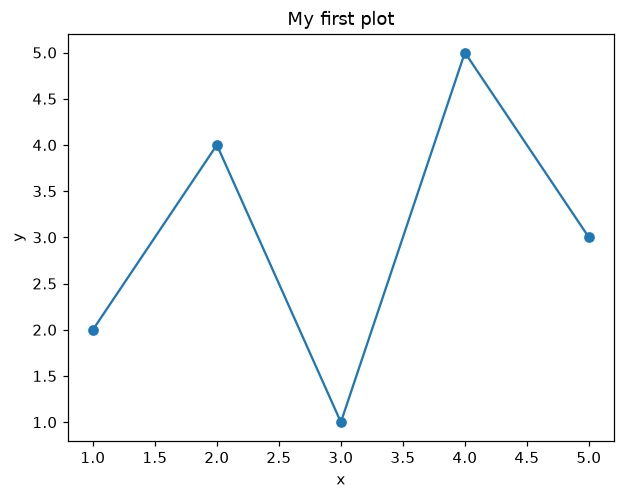
plt.plot(x, y) connects the points (1, 2), (2, 4), (3, 1) and so on in order; marker="o" also draws a dot on each point. plt.title, plt.xlabel and plt.ylabel label the chart. Nothing appears until plt.show(). The same chart can be written with fig, ax = plt.subplots() and ax.plot: pyplot is shorter for one chart, the ax style is clearer when a figure has several charts.
Interactive visualizer
Pick a data set, switch between the pyplot style (plt.plot) and the object-oriented style (ax.plot), and turn each label on and off. Both styles draw the same chart.
Runnable Matplotlib example
import matplotlib.pyplot as plt

x = [1, 2, 3, 4, 5]
y = [2, 4, 1, 5, 3]

plt.plot(x, y, marker="o")
plt.title("My first plot")
plt.xlabel("x")
plt.ylabel("y")
plt.show()