Complex Layouts with subplot_mosaic
Build figures with charts of different sizes using plt.subplot_mosaic and width and height ratios.
Introduction
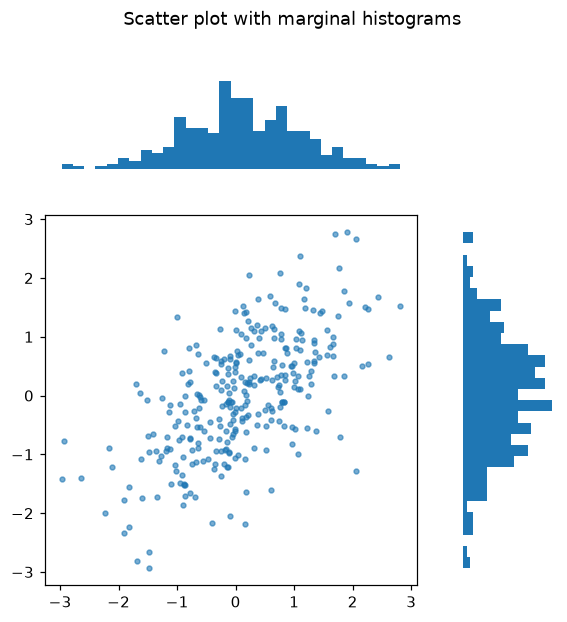
plt.subplots makes a regular grid, but real figures often need a big main chart with smaller ones around it. plt.subplot_mosaic lets you draw the layout as a list of rows, giving each chart a name.
Each inner list is a row and each name is a chart; a name repeated across cells makes a bigger chart, and "." leaves a cell empty. axes is a dictionary, so axes["main"] is the scatter plot. gridspec_kw sets the relative sizes: the main column is four times as wide as the right one. The histograms on the edges show how x and y are distributed.
Interactive visualizer
Pick a layout and switch the size ratios on and off. Each name in the mosaic becomes one chart.
Runnable Matplotlib example
Matplotlib
main.py
import matplotlib.pyplot as plt
import numpy as np

rng = np.random.default_rng(4)
x = rng.normal(size=300)
y = 0.6 * x + rng.normal(scale=0.8, size=300)

fig, axes = plt.subplot_mosaic([["top", "."], ["main", "right"]], figsize=(6, 6),
                               gridspec_kw={"width_ratios": [4, 1], "height_ratios": [1, 4]})
axes["main"].scatter(x, y, s=10, alpha=0.6)
axes["top"].hist(x, bins=30)
axes["right"].hist(y, bins=30, orientation="horizontal")
axes["top"].axis("off")
axes["right"].axis("off")
fig.suptitle("Scatter plot with marginal histograms")
plt.show()