Axis Limits, Ticks, and Log Scale
Set axis limits, choose tick positions and labels, and switch to a log scale with set_yscale.
Introduction
Matplotlib picks axis limits and ticks for you, but you often know better. set_xlim and set_ylim choose the visible range, set_xticks chooses where the ticks go and what they say, and set_yscale("log") makes growth that doubles look like a straight line.
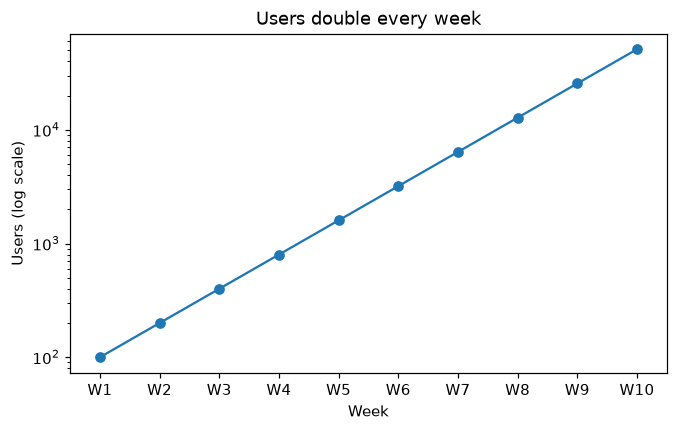
The users double every week, so on a normal axis the first weeks look flat and the last ones shoot up. On a log scale each doubling takes the same height, so the line is straight and every week is readable. set_xticks(x, labels) puts one tick on each week and names it W1, W2 and so on; set_xlim adds a little room at both ends.
Interactive visualizer
Switch the log scale on and off. On a normal axis the first weeks hide near zero; on a log scale every doubling takes the same height.
Runnable Matplotlib example
import matplotlib.pyplot as plt
import numpy as np

x = np.arange(1, 11)
users = 50 * 2.0 ** x

fig, ax = plt.subplots(figsize=(7, 4))
ax.plot(x, users, marker="o")
ax.set_yscale("log")
ax.set_xlim(0.5, 10.5)
ax.set_xticks(x, [f"W{i}" for i in x])
ax.set_xlabel("Week")
ax.set_ylabel("Users (log scale)")
ax.set_title("Users double every week")
plt.show()