Annotations, Text, and Reference Lines
Point at important values with ax.annotate, add notes with ax.text and mark targets with axhline.
Introduction
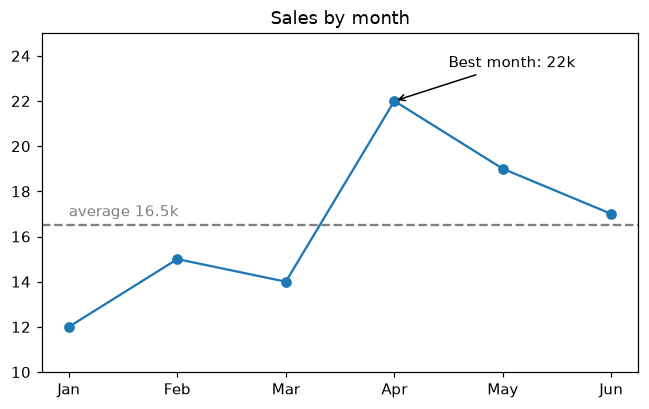
A good chart tells the reader where to look. ax.annotate writes a label with an arrow pointing at a data point, ax.text places free text, and ax.axhline or ax.axvline draws a reference line such as an average or a target.
xy is the point the arrow points at and xytext is where the label sits; arrowprops draws the arrow. On a chart with text categories the x positions are 0, 1, 2 and so on, so the best month is at x = best. axhline draws the average across the whole chart, and ax.text explains what the dashed line means.
Interactive visualizer
Choose which point to annotate, remove the arrow and the average line, and see which line of code draws each part.
Runnable Matplotlib example
Matplotlib
main.py
import matplotlib.pyplot as plt

months = ["Jan", "Feb", "Mar", "Apr", "May", "Jun"]
sales = [12, 15, 14, 22, 19, 17]
best = sales.index(max(sales))
average = sum(sales) / len(sales)

fig, ax = plt.subplots(figsize=(7, 4))
ax.plot(months, sales, marker="o")
ax.annotate(f"Best month: {sales[best]}k", xy=(best, sales[best]), xytext=(best + 0.5, sales[best] + 1.5),
            arrowprops=dict(arrowstyle="->"))
ax.axhline(average, color="gray", linestyle="--")
ax.text(0, average + 0.4, f"average {average:.1f}k", color="gray")
ax.set_ylim(10, 25)
ax.set_title("Sales by month")
plt.show()