
Matplotlib vs seaborn
seaborn is not a replacement for Matplotlib: it is built on top of it. Use seaborn to make statistical charts from a DataFrame in one line, and Matplotlib to control every detail. The examples below draw the same data with both; seaborn is installed in the online editor, so you can run them as they are.
Differences at a glance
| Matplotlib | seaborn | |
|---|---|---|
| What it is | The base plotting library for Python | A statistics library built on Matplotlib |
| Code for a grouped chart | Several lines: split the data, then plot each group | Usually one call with data=, x=, y=, hue= |
| Input data | Lists and NumPy arrays (DataFrames work too) | Designed for pandas DataFrames in long format |
| Default look | Plain; style it yourself | Polished themes and color palettes |
| Statistics built in | No: compute means, fits and intervals yourself | Yes: regression lines, confidence intervals, KDE, aggregation |
| Customization | Every part of the figure | Through Matplotlib: seaborn returns Matplotlib axes |
| Chart types | Anything: 3D, animations, maps with add-ons, custom layouts | Statistical charts: distributions, categories, relations, heatmaps, pair plots |
| Learn first? | Yes, the basics | After the Matplotlib basics |
The same chart in both
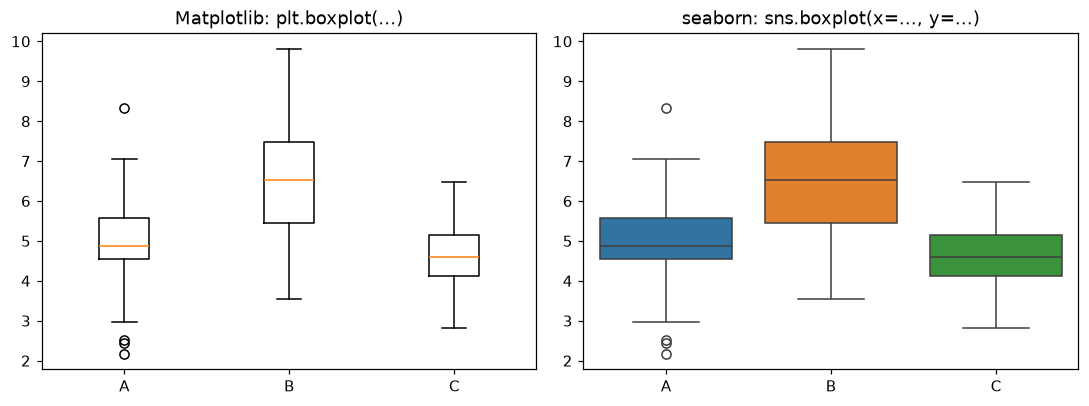
Matplotlib
import matplotlib.pyplot as plt
import numpy as np

rng = np.random.default_rng(3)
scores = {"A": rng.normal(5, 1, 60), "B": rng.normal(6.5, 1.3, 60), "C": rng.normal(4.5, 0.8, 60)}

fig, ax = plt.subplots(figsize=(7, 4))
ax.boxplot(list(scores.values()))
ax.set_xticks([1, 2, 3], list(scores.keys()))
ax.set_xlabel("group")
ax.set_ylabel("score")
ax.set_title("Matplotlib boxplot")
plt.show()
seaborn
import matplotlib.pyplot as plt
import numpy as np
import pandas as pd
import seaborn as sns

rng = np.random.default_rng(3)
df = pd.DataFrame({
    "group": np.repeat(["A", "B", "C"], 60),
    "score": np.concatenate([rng.normal(5, 1, 60), rng.normal(6.5, 1.3, 60), rng.normal(4.5, 0.8, 60)]),
})

# One call: seaborn groups the DataFrame, colors the boxes and labels the axes
ax = sns.boxplot(data=df, x="group", y="score", hue="group", legend=False)
ax.set_title("seaborn boxplot")  # finish with Matplotlib
plt.show()
When to use which
- Use seaborn forExploring a DataFrame: distributions (histplot, kdeplot), comparing groups (boxplot, violinplot, barplot with error bars), relationships (scatterplot, regplot, pairplot) and correlation heatmaps.
- Use Matplotlib forExact layouts, annotations and arrows, dual axes, animations, 3D plots, and charts that are not summaries of a table, such as plotting a function.
- Use bothDraw with seaborn, then adjust with Matplotlib: titles, limits, ticks, saving with savefig. seaborn functions accept ax= so they fit into Matplotlib subplots.
import matplotlib.pyplot as plt
import numpy as np
import pandas as pd
import seaborn as sns

rng = np.random.default_rng(7)
df = pd.DataFrame({"hours": rng.uniform(0, 10, 120)})
df["score"] = 50 + 4.5 * df["hours"] + rng.normal(0, 6, 120)

fig, (left, right) = plt.subplots(1, 2, figsize=(11, 4))

# seaborn: scatter plot with a fitted regression line and confidence band
sns.regplot(data=df, x="hours", y="score", ax=left)
left.set_title("seaborn regplot")

# Matplotlib: the same data with a custom annotation
right.scatter(df["hours"], df["score"], s=15, alpha=0.6)
best = df.loc[df["score"].idxmax()]
right.annotate("top score", xy=(best["hours"], best["score"]), xytext=(1, best["score"]),
               arrowprops={"arrowstyle": "->"})
right.set_xlabel("hours")
right.set_title("Matplotlib scatter + annotate")

plt.tight_layout()
plt.show()
Learn Matplotlib
Frequently asked questions
Is seaborn better than Matplotlib?
Neither is better in general. seaborn makes statistical charts from DataFrames in one line with good defaults; Matplotlib gives full control over every part of a figure. Most people use both.
Does seaborn replace Matplotlib?
No. seaborn is built on Matplotlib and returns Matplotlib axes, so you finish a seaborn chart with Matplotlib calls such as ax.set_title or plt.savefig.
Which should a beginner learn first?
Learn the basics of Matplotlib first (figure, axes, plot, labels). seaborn then makes sense, and you can fix its charts when the defaults are not what you want.
Can I use seaborn online?
Yes. seaborn is installed in the Matplotlib online editor, so import seaborn as sns works without installing anything.
When should I use plain Matplotlib?
For custom layouts, annotations, animations, 3D plots, and charts that are not statistical summaries of a table.