
Matplotlib Markers, Line Styles and Legend Location
Every marker and line style Matplotlib draws, with a picture of each, plus the legend positions and how to move the legend outside the plot. Run the examples online and change them.
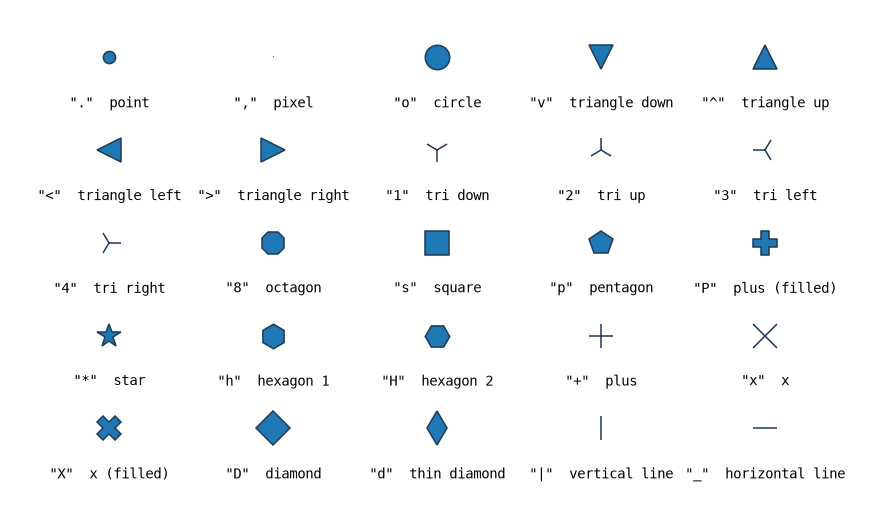
Matplotlib markers
Pass the code as marker= in plot or scatter. markersize (ms), markerfacecolor (mfc) and markeredgecolor (mec) change the size and colors.
Line styles (linestyle)
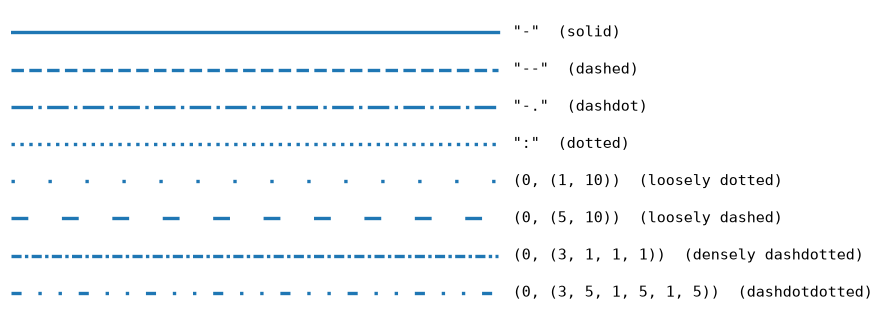
Set linestyle= (or ls=), and linewidth= (lw=) for the thickness.
| linestyle | Name | Use |
|---|---|---|
"-" | solid | The default line. |
"--" | dashed | Common for predictions, targets and second series. |
"-." | dashdot | A third style when colors are not enough. |
":" | dotted | Light reference lines and grids. |
"none" | no line | Markers only, like a scatter plot. |
(0, (5, 10)) | custom dashes | (offset, (on, off, ...)) in points: 5 on, 10 off. |
Format strings: color, marker and line in one
The third argument of plt.plot combines all three: "ro--" is red circles joined by a dashed line, "g^" green triangles with no line, "k:" a black dotted line. Colors here are single letters; for other colors use color= with a named color or hex code.
import matplotlib.pyplot as plt
import numpy as np

x = np.arange(1, 11)
fig, ax = plt.subplots(figsize=(8, 5))

ax.plot(x, x, marker="o", label='marker="o"')
ax.plot(x, x + 3, marker="s", linestyle="--", label='marker="s", linestyle="--"')
ax.plot(x, x + 6, "^:", markersize=9, label='"^:" format string')
ax.plot(x, x + 9, marker="*", markersize=14, markerfacecolor="gold",
        markeredgecolor="black", linestyle="none", label="markers only")

ax.legend()
ax.set_title("Markers and line styles")
plt.show()
Matplotlib legend location
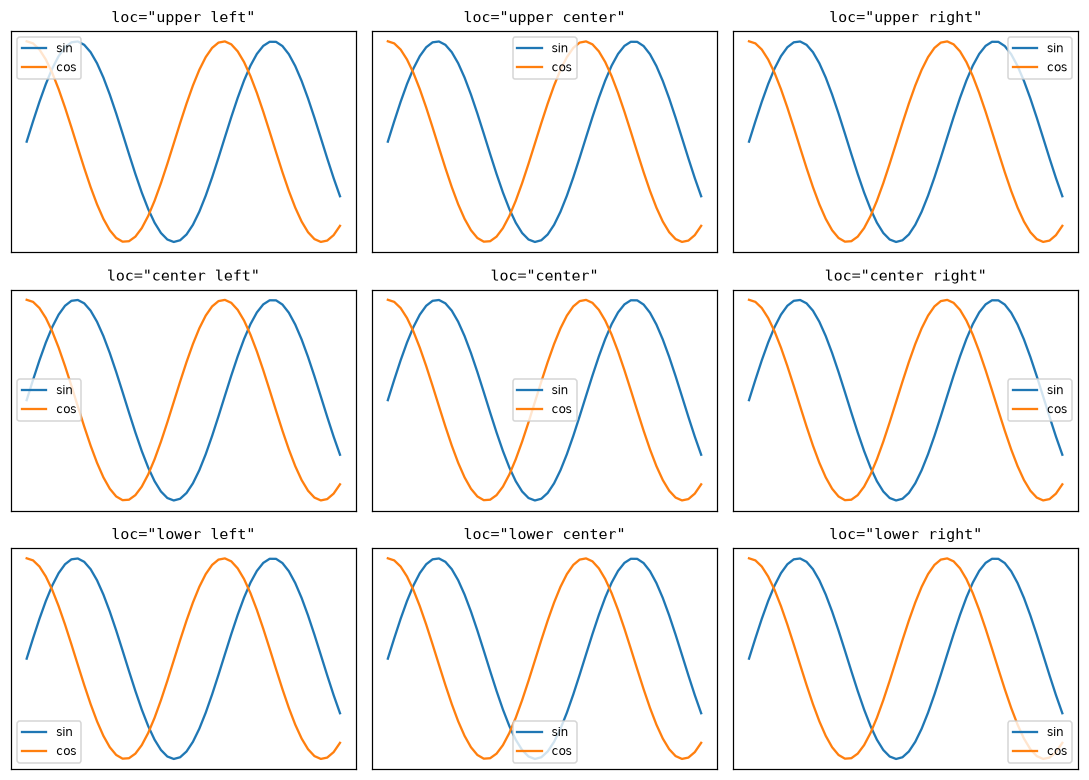
plt.legend(loc=...) takes a position name or its number. The default "best" (0) picks the place that covers the fewest points.
| loc | Number | loc | Number |
|---|---|---|---|
"best" | 0 | "center left" | 6 |
"upper right" | 1 | "center right" | 7 |
"upper left" | 2 | "lower center" | 8 |
"lower left" | 3 | "upper center" | 9 |
"lower right" | 4 | "center" | 10 |
"right" | 5 |
Put the legend outside the plot
bbox_to_anchor gives the point in axes coordinates (0 to 1 is inside the axes) where the loc corner of the legend goes. loc="upper left", bbox_to_anchor=(1.02, 1) puts it just to the right of the plot; call plt.tight_layout() so it is not cut off. Other useful options: ncol=2 for columns, frameon=False for no box, title="Series" for a heading.
import matplotlib.pyplot as plt
import numpy as np

x = np.linspace(0, 10, 100)
fig, (inside, outside) = plt.subplots(1, 2, figsize=(11, 4))

for ax in (inside, outside):
    ax.plot(x, np.sin(x), label="sin(x)")
    ax.plot(x, np.cos(x), label="cos(x)")

inside.legend(loc="lower left")
inside.set_title('loc="lower left"')

# Outside the plot: anchor the legend's upper left corner just right of the axes
outside.legend(loc="upper left", bbox_to_anchor=(1.02, 1))
outside.set_title("Legend outside the plot")

plt.tight_layout()
plt.show()
More Matplotlib
Frequently asked questions
How do I change the marker in Matplotlib?
Pass marker, for example plt.plot(x, y, marker="o"), or use a format string such as "o-" for circles joined by a line. markersize and markerfacecolor change the size and fill.
How do I make a dashed line?
Use linestyle="--" (or ls="--"). Other styles are "-", "-." and ":", or a dash tuple such as (0, (5, 10)) for a custom pattern.
How do I move the legend?
plt.legend(loc="upper left") places it inside the plot. For outside the plot, combine loc with bbox_to_anchor, for example loc="upper left", bbox_to_anchor=(1.02, 1).
What does loc="best" do?
It is the default for plt.legend. Matplotlib picks the place that covers the fewest data points.
How do I plot points without a line?
Use plt.scatter, or plt.plot with linestyle="none" (or a format string with only a marker, such as "o").