Plotting pandas DataFrames
Turn a pandas DataFrame into a chart with df.plot and customize it with Matplotlib.
Introduction
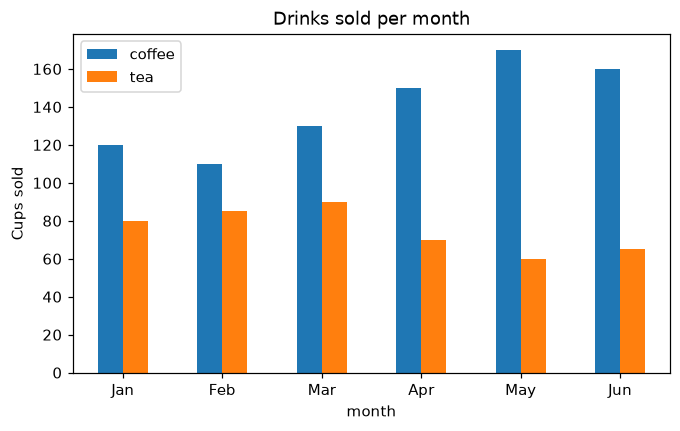
pandas has Matplotlib built in: df.plot draws a chart straight from a DataFrame, using the column names for the legend. It returns a Matplotlib Axes, so everything you learned still works for titles, labels and styling.
x="month" puts the months on the x axis and y=[...] picks the columns to draw; kind chooses the chart ("line", "bar", "barh", "area"...). df.plot returns ax, the usual Matplotlib Axes, so ax.set_ylabel and ax.set_title work as before. rot=0 keeps the month names horizontal, and stacked=True would stack the bars.
Interactive visualizer
Change kind, pick the columns and stack them. pandas draws the chart with Matplotlib and returns an Axes you can keep styling.
Runnable Matplotlib example
Matplotlib
main.py
import matplotlib.pyplot as plt
import pandas as pd

df = pd.DataFrame({
    "month": ["Jan", "Feb", "Mar", "Apr", "May", "Jun"],
    "coffee": [120, 110, 130, 150, 170, 160],
    "tea": [80, 85, 90, 70, 60, 65],
})

ax = df.plot(x="month", y=["coffee", "tea"], kind="bar", rot=0, figsize=(7, 4))
ax.set_ylabel("Cups sold")
ax.set_title("Drinks sold per month")
plt.show()