Saving Figures: savefig, DPI, and Size
Save charts as PNG or SVG with fig.savefig and control their size, resolution and margins.
Introduction
To use a chart in a report or on a website, save it to a file. figsize sets the size in inches, dpi sets how many pixels each inch gets, and bbox_inches="tight" trims the empty margin around the chart.
The image is figsize × dpi pixels: 6 × 150 = 900 pixels wide and 4 × 150 = 600 high. PNG is made of pixels, so pick a higher dpi for print; SVG is made of shapes and stays sharp at any size. bbox_inches="tight" cuts the white margin, and transparent=True would remove the background. In the online editor the saved files appear in your workspace.
Interactive visualizer
Change the size in inches and the dpi and watch the size of the saved image in pixels change.
Runnable Matplotlib example
Matplotlib
main.py
import matplotlib.pyplot as plt

fig, ax = plt.subplots(figsize=(6, 4))
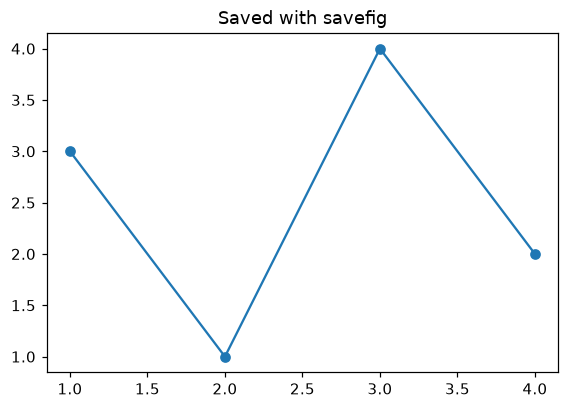
ax.plot([1, 2, 3, 4], [3, 1, 4, 2], marker="o")
ax.set_title("Saved with savefig")

fig.savefig("chart.png", dpi=150, bbox_inches="tight")
fig.savefig("chart.svg")
print("Saved chart.png and chart.svg")
plt.show()