Error Bars and Uncertainty
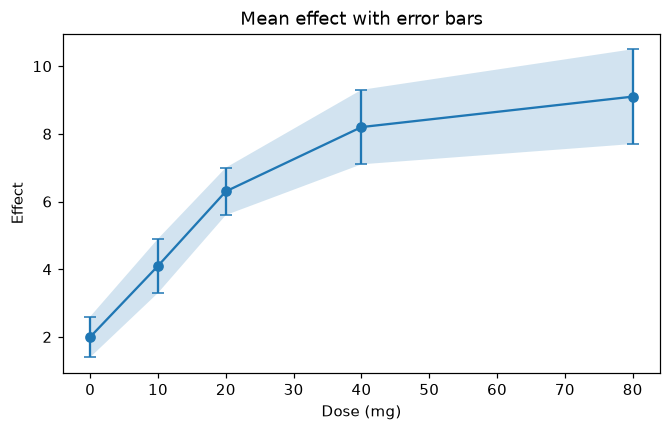
Show measurement uncertainty with ax.errorbar and a shaded band with fill_between.
Introduction
Measured values are never exact. Error bars show how far each value could reasonably be from the one you measured, so readers can tell real differences from noise. A shaded band does the same for a whole line.
yerr gives the size of the error above and below each point, fmt="o-" draws dots joined by a line, and capsize adds small caps to the ends of the bars. fill_between shades the area between effect - error and effect + error. Where two bands overlap a lot, the difference between those points may just be noise.
Interactive visualizer
Make the errors bigger or smaller, change the caps and turn the shaded band on and off.
Runnable Matplotlib example
Matplotlib
main.py
import matplotlib.pyplot as plt
import numpy as np

doses = np.array([0, 10, 20, 40, 80])
effect = np.array([2.0, 4.1, 6.3, 8.2, 9.1])
error = np.array([0.6, 0.8, 0.7, 1.1, 1.4])

fig, ax = plt.subplots(figsize=(7, 4))
ax.errorbar(doses, effect, yerr=error, fmt="o-", capsize=4)
ax.fill_between(doses, effect - error, effect + error, alpha=0.2)
ax.set_xlabel("Dose (mg)")
ax.set_ylabel("Effect")
ax.set_title("Mean effect with error bars")
plt.show()