Axis Limits, Ticks, and Log Scale
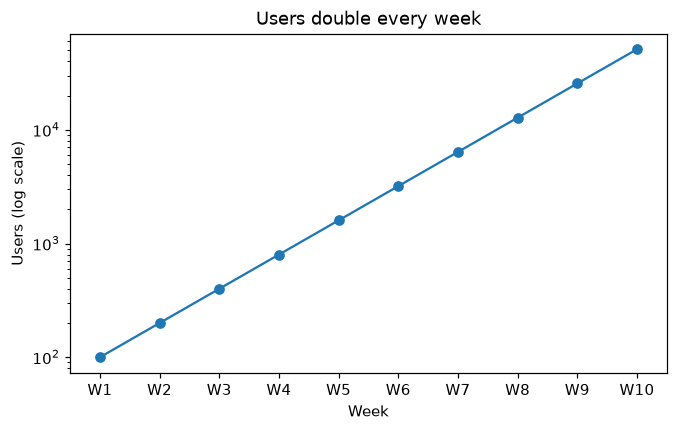
Set axis limits, choose tick positions and labels, and switch to a log scale with set_yscale.
View lesson →
Control axes and ticks, annotate the story, show spread and uncertainty, stack data, plot pandas DataFrames and save figures for reports.
Try Matplotlib onlineSet axis limits, choose tick positions and labels, and switch to a log scale with set_yscale.
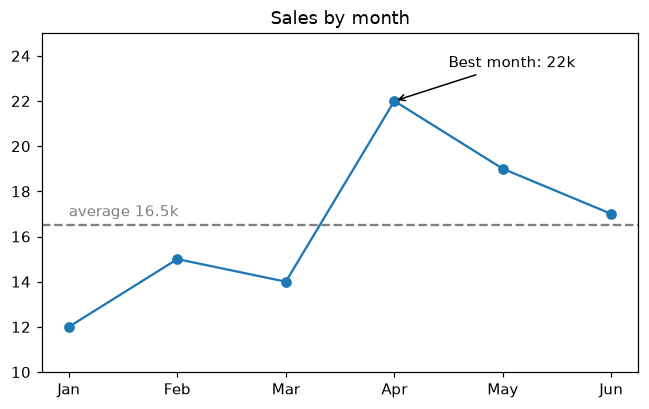
View lesson →Point at important values with ax.annotate, add notes with ax.text and mark targets with axhline.
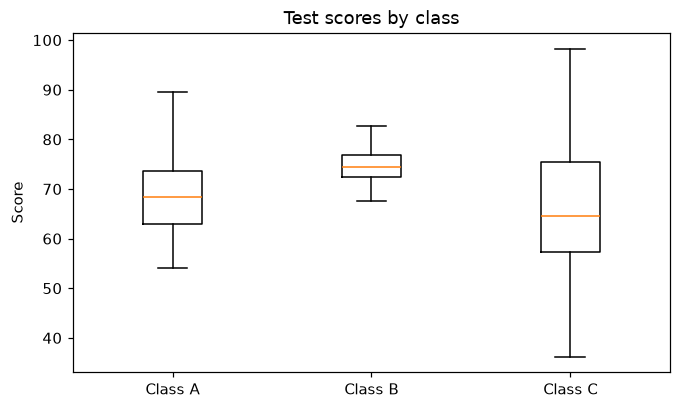
View lesson →Compare the spread of several groups with ax.boxplot and ax.violinplot.
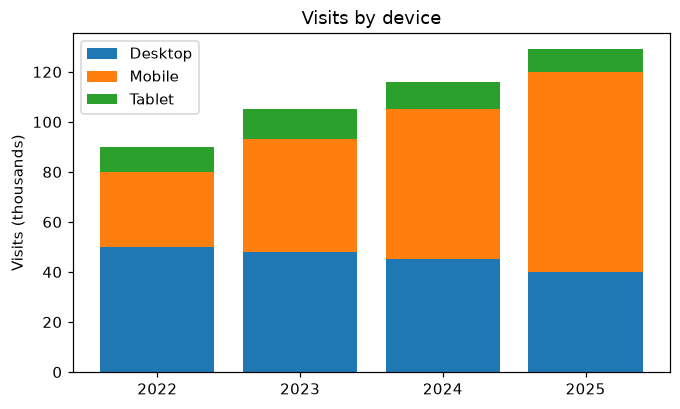
View lesson →Show how parts add up over time with stacked bars (bottom=) and ax.stackplot.
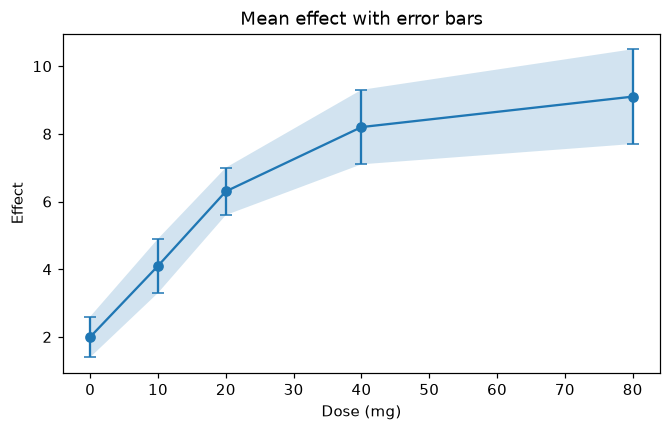
View lesson →Show measurement uncertainty with ax.errorbar and a shaded band with fill_between.
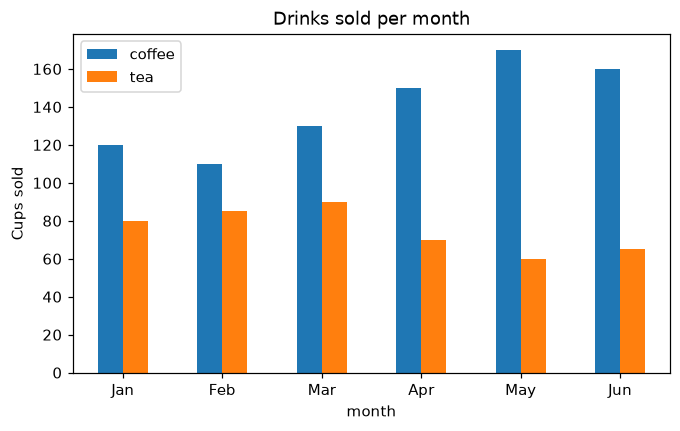
View lesson →Turn a pandas DataFrame into a chart with df.plot and customize it with Matplotlib.
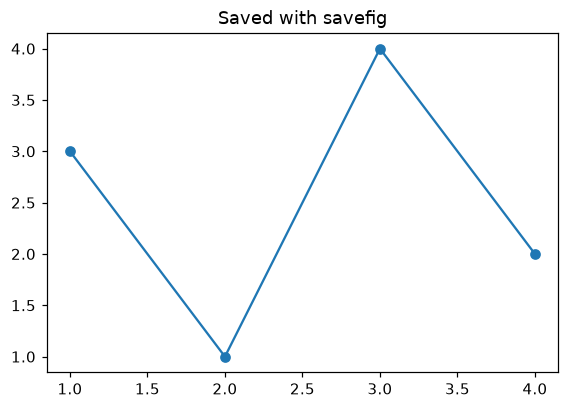
View lesson →Save charts as PNG or SVG with fig.savefig and control their size, resolution and margins.
View lesson →