Pie Charts
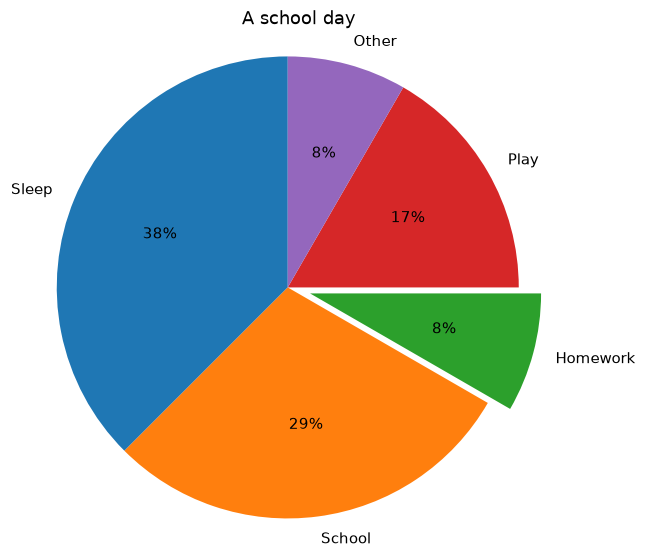
Show parts of a whole with ax.pie, percentages and an exploded slice.
Introduction
A pie chart shows how a whole splits into parts. Use it for a few categories that add up to 100%; for many categories or close values, a bar chart is easier to read.
autopct writes each slice's percentage ("%1.0f%%" means no decimals). explode pulls a slice out by a fraction of the radius to highlight it, startangle rotates the pie, and ax.axis("equal") keeps it round.
Interactive visualizer
Rotate the pie, pull out a slice and switch to a donut chart.
Runnable Matplotlib example
Matplotlib
main.py
import matplotlib.pyplot as plt

activities = ["Sleep", "School", "Homework", "Play", "Other"]
hours = [9, 7, 2, 4, 2]

fig, ax = plt.subplots(figsize=(6, 6))
ax.pie(hours, labels=activities, autopct="%1.0f%%", startangle=90, explode=[0, 0, 0.1, 0, 0])
ax.axis("equal")
ax.set_title("A school day")
plt.show()