Histograms
See how values are distributed by grouping them into bins.
Introduction
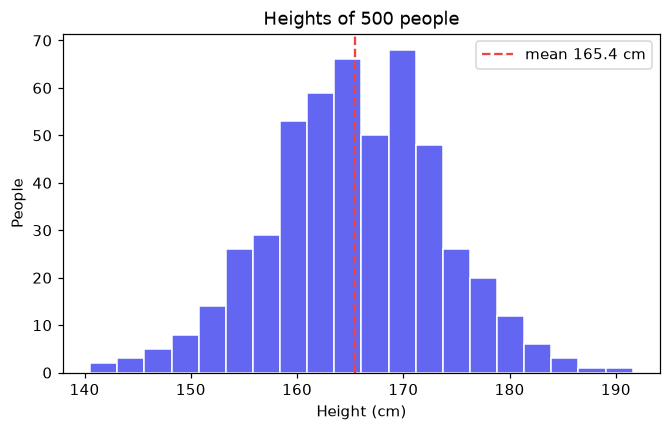
A histogram splits a range of values into bins and counts how many values fall into each. It shows where values cluster and how spread out they are.
bins sets how many bars the range is split into: too few hide the shape, too many make it noisy. edgecolor separates the bars. ax.axvline draws a vertical line, here at the mean, to mark the center of the data.
Interactive visualizer
Change the number of bins and the distribution. Too few bins hide the shape; too many make it noisy.
Runnable Matplotlib example
Matplotlib
main.py
import matplotlib.pyplot as plt
import numpy as np

rng = np.random.default_rng(3)
heights = rng.normal(165, 8, 500)

fig, ax = plt.subplots(figsize=(7, 4))
ax.hist(heights, bins=20, color="#6366f1", edgecolor="white")
ax.axvline(heights.mean(), color="#ef4444", linestyle="--", label=f"mean {heights.mean():.1f} cm")
ax.set_xlabel("Height (cm)")
ax.set_ylabel("People")
ax.set_title("Heights of 500 people")
ax.legend()
plt.show()