Bar Charts
Compare values across categories with vertical and horizontal bars.
Introduction
Bar charts compare a value across categories. ax.bar draws vertical bars and ax.barh horizontal ones, which work better when category names are long.
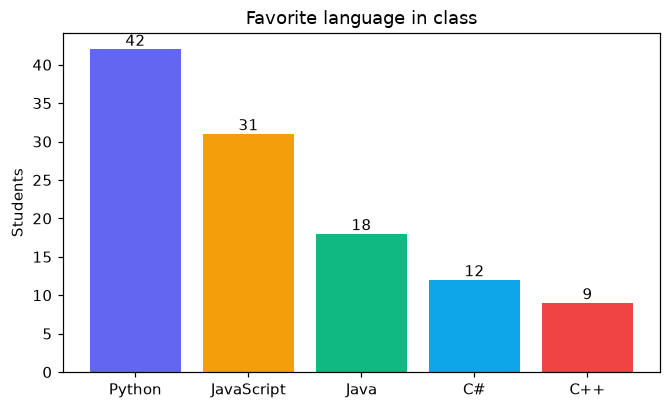
The first argument gives the categories and the second their values. color can be a list with one color per bar. ax.bar_label writes each value on top of its bar, so readers do not have to guess from the axis.
Interactive visualizer
Switch to horizontal bars, sort the bars and show their values. Sorted bars make the ranking easy to see.
Runnable Matplotlib example
Matplotlib
main.py
import matplotlib.pyplot as plt

languages = ["Python", "JavaScript", "Java", "C#", "C++"]
students = [42, 31, 18, 12, 9]

fig, ax = plt.subplots(figsize=(7, 4))
bars = ax.bar(languages, students, color=["#6366f1", "#f59e0b", "#10b981", "#0ea5e9", "#ef4444"])
ax.bar_label(bars)
ax.set_title("Favorite language in class")
ax.set_ylabel("Students")
plt.show()