Several Charts in One Figure
Arrange a grid of charts with plt.subplots(rows, columns).
Introduction
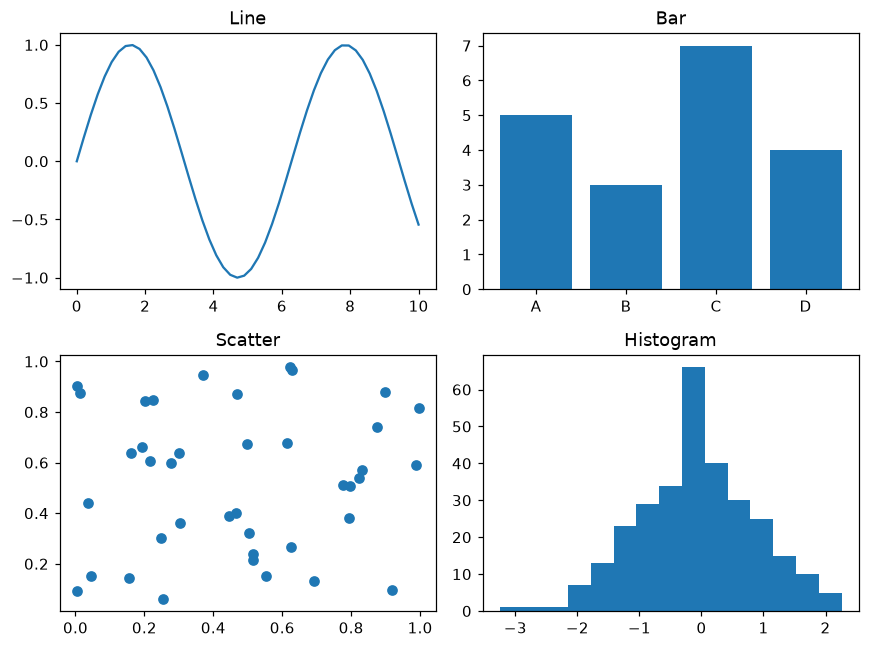
plt.subplots(rows, cols) returns a figure and a grid of Axes. Each Axes is an independent chart, so you can compare different views of your data side by side.
axes is a 2 × 2 array: axes[0, 0] is the top left chart and axes[1, 1] the bottom right. Each one gets its own plot and title. fig.tight_layout adjusts the spacing so titles and labels do not overlap.
Interactive visualizer
Change the number of rows and columns. Notice how you index the charts with axes[i] in a single row or column, and axes[row, col] in a grid.
Runnable Matplotlib example
Matplotlib
main.py
import matplotlib.pyplot as plt
import numpy as np

rng = np.random.default_rng(7)
x = np.linspace(0, 10, 50)

fig, axes = plt.subplots(2, 2, figsize=(8, 6))
axes[0, 0].plot(x, np.sin(x))
axes[0, 0].set_title("Line")
axes[0, 1].bar(["A", "B", "C", "D"], [5, 3, 7, 4])
axes[0, 1].set_title("Bar")
axes[1, 0].scatter(rng.random(40), rng.random(40))
axes[1, 0].set_title("Scatter")
axes[1, 1].hist(rng.normal(size=300), bins=15)
axes[1, 1].set_title("Histogram")
fig.tight_layout()
plt.show()