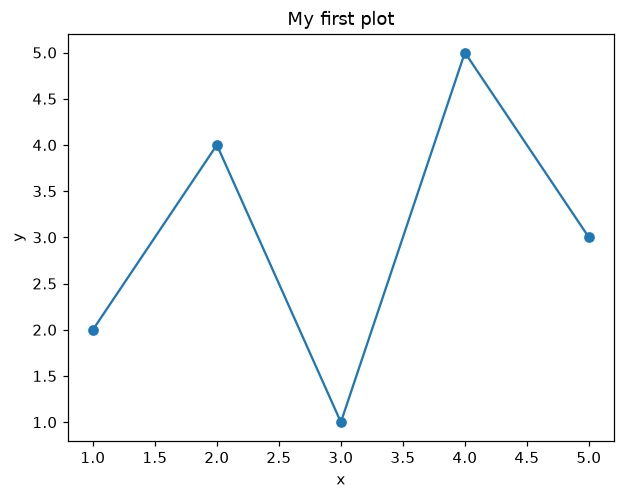
Matplotlib pyplot Basics: plt.plot and plt.show
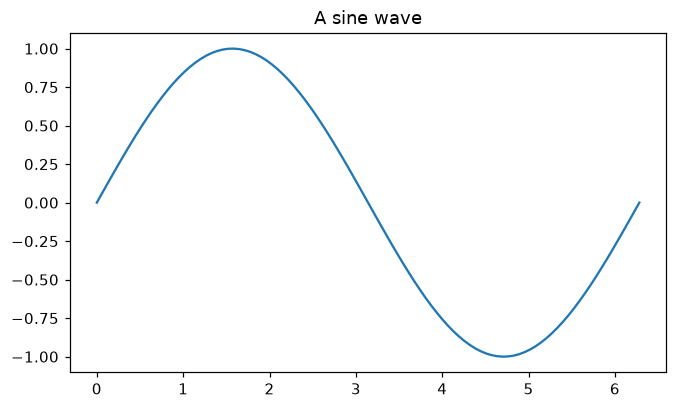
Plot a graph in Python in a few lines with matplotlib.pyplot: plt.plot, plt.title, plt.xlabel and plt.show.
View lesson →
Draw your first charts, then add titles, labels, legends, colors, styles and several charts in one figure.
Try Matplotlib onlinePlot a graph in Python in a few lines with matplotlib.pyplot: plt.plot, plt.title, plt.xlabel and plt.show.
View lesson →Draw a smooth line graph from NumPy data with plt.subplots and ax.plot.
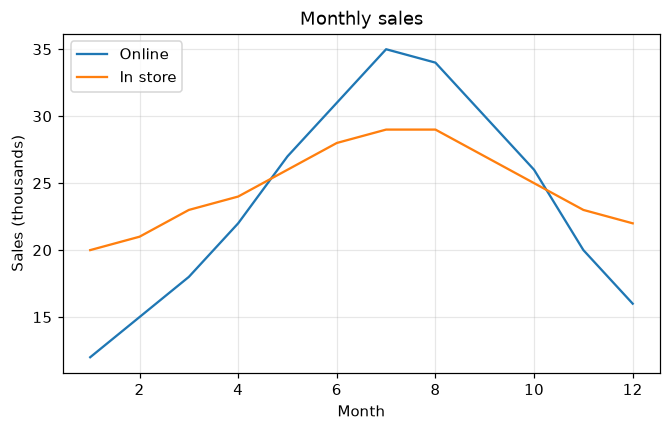
View lesson →Explain a chart with a title, axis labels, a legend and a grid.
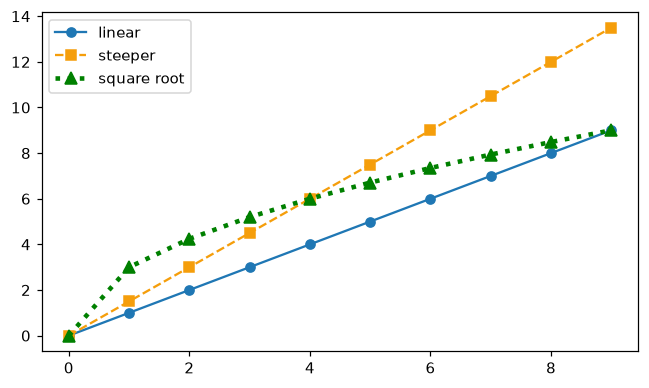
View lesson →Change the color, line style, line width and markers of each line.
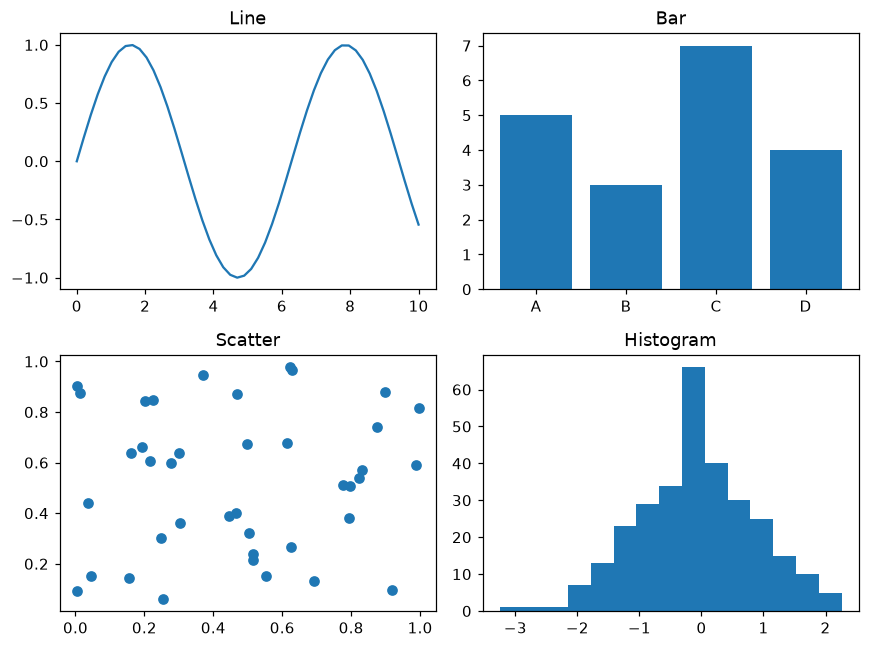
View lesson →Arrange a grid of charts with plt.subplots(rows, columns).
View lesson →