Project: Build a Sales Dashboard
Combine line, bar and histogram charts, annotations and a style into a 2 × 2 sales dashboard.
Introduction
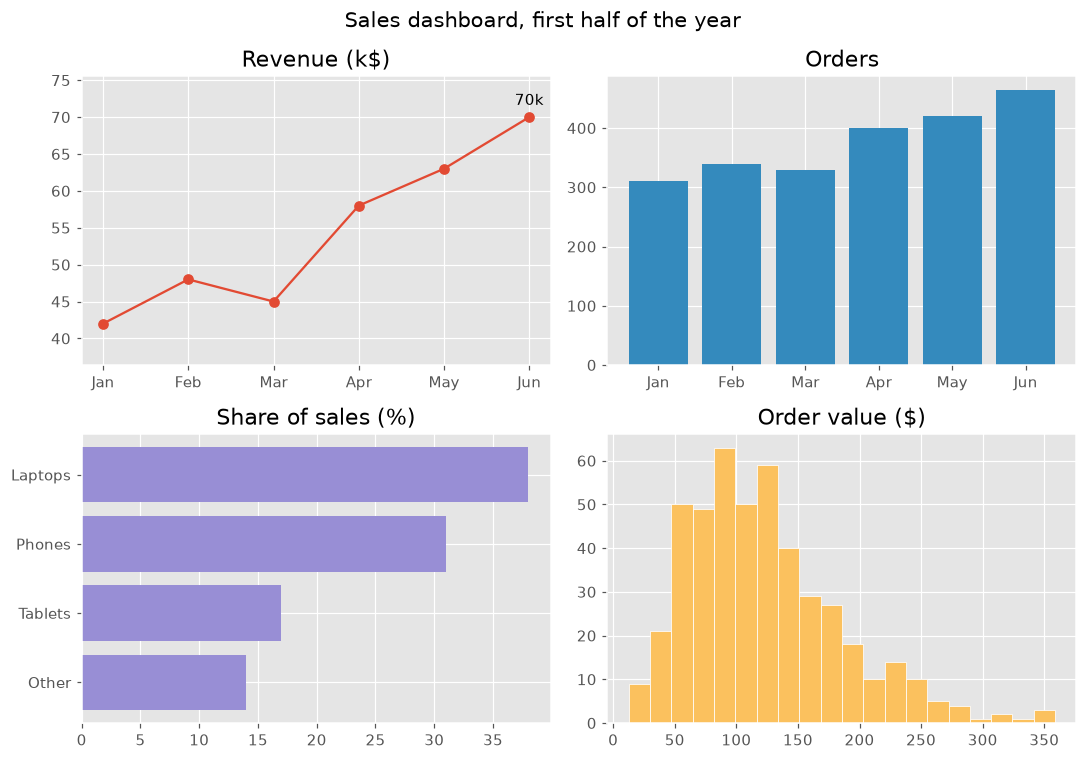
This project puts the course together: four charts in one figure, each answering one question about the same sales data. A shared style and clear titles make the dashboard easy to read at a glance.
plt.style.use sets colors and fonts for the whole figure. Each panel answers one question: how revenue grows (a line with the best month annotated), how many orders there were (bars), what sells (horizontal bars, sorted) and how big orders usually are (a histogram). color="C1" picks the second color of the style, so each panel gets its own color, and margins leaves room for the label. suptitle titles the whole figure and tight_layout keeps the panels from overlapping. Try another style, such as "fivethirtyeight" or "bmh".
Interactive visualizer
Switch the style to restyle the whole dashboard at once, and pick a panel to see the code that draws it.
Runnable Matplotlib example
import matplotlib.pyplot as plt
import numpy as np

plt.style.use("ggplot")
months = ["Jan", "Feb", "Mar", "Apr", "May", "Jun"]
revenue = np.array([42, 48, 45, 58, 63, 70])
orders = np.array([310, 340, 330, 400, 420, 465])
products = {"Other": 14, "Tablets": 17, "Phones": 31, "Laptops": 38}
order_values = np.random.default_rng(8).gamma(4, 30, 465)

fig, axes = plt.subplots(2, 2, figsize=(10, 7))
fig.suptitle("Sales dashboard, first half of the year", fontsize=14)

axes[0, 0].plot(months, revenue, marker="o")
best = revenue.argmax()
axes[0, 0].annotate(f"{revenue[best]}k", (best, revenue[best]), xytext=(0, 8), textcoords="offset points", ha="center")
axes[0, 0].margins(y=0.2)
axes[0, 0].set_title("Revenue (k$)")

axes[0, 1].bar(months, orders, color="C1")
axes[0, 1].set_title("Orders")

axes[1, 0].barh(list(products), list(products.values()), color="C2")
axes[1, 0].set_title("Share of sales (%)")

axes[1, 1].hist(order_values, bins=20, color="C4", edgecolor="white")
axes[1, 1].set_title("Order value ($)")

fig.tight_layout()
plt.show()