Animations with FuncAnimation
Animate a chart frame by frame with FuncAnimation and save it as a GIF.
Introduction
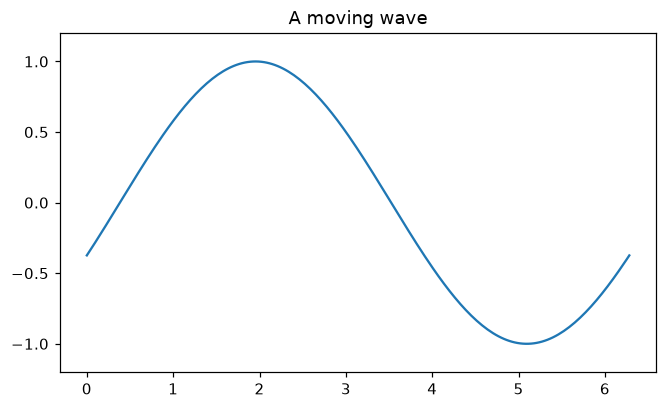
An animation is a chart redrawn many times. FuncAnimation calls your update function once per frame; the function changes the data of the existing line instead of drawing a new chart, which keeps it fast.
ax.plot returns a list of lines, and line, = takes the only one. update(frame) receives 0, 1, 2 ... and shifts the wave a little each time with set_ydata. frames is the number of frames and interval the delay between them in milliseconds. animation.save writes a GIF with PillowWriter; in the online editor the GIF appears in your workspace and plt.show() shows the last frame.
Interactive visualizer
Press play, drag the frame slider and change the number of frames and the interval. The highlighted line runs once per frame.
Runnable Matplotlib example
import matplotlib.pyplot as plt
import numpy as np
from matplotlib.animation import FuncAnimation, PillowWriter

x = np.linspace(0, 2 * np.pi, 200)
fig, ax = plt.subplots(figsize=(7, 4))
line, = ax.plot(x, np.sin(x))
ax.set_ylim(-1.2, 1.2)
ax.set_title("A moving wave")

def update(frame):
    line.set_ydata(np.sin(x + frame / 10))
    return line,

animation = FuncAnimation(fig, update, frames=60, interval=50)
animation.save("wave.gif", writer=PillowWriter(fps=20))
print("Saved wave.gif")
plt.show()