Heatmaps with imshow and Colormaps
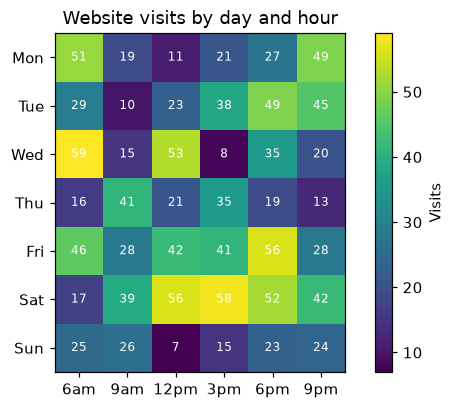
Draw a heatmap of a 2D table with ax.imshow, a colormap, a colorbar and a value in each cell.
View lesson →
Heatmaps, two y axes, complex layouts, 3D surfaces and animations, then put it all together in a dashboard project.
Try Matplotlib onlineDraw a heatmap of a 2D table with ax.imshow, a colormap, a colorbar and a value in each cell.
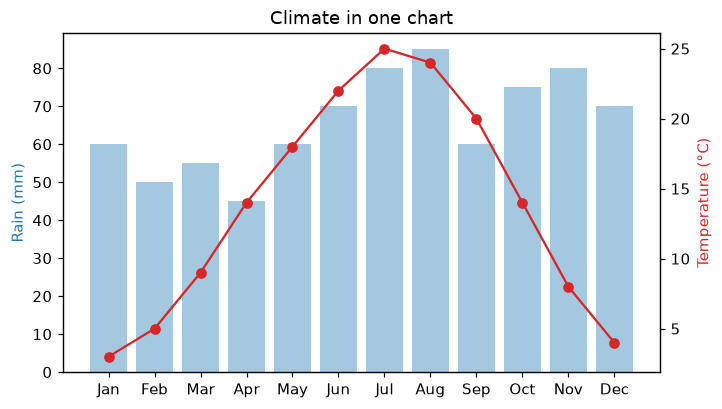
View lesson →Plot two measures with different units on one chart using a second y axis from ax.twinx.
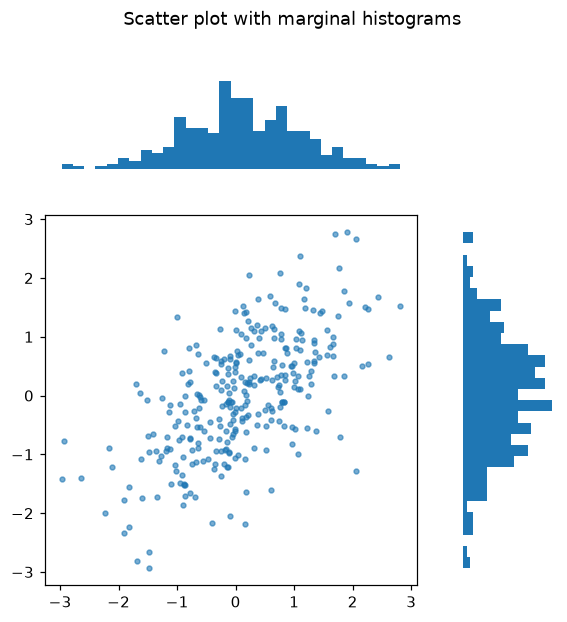
View lesson →Build figures with charts of different sizes using plt.subplot_mosaic and width and height ratios.
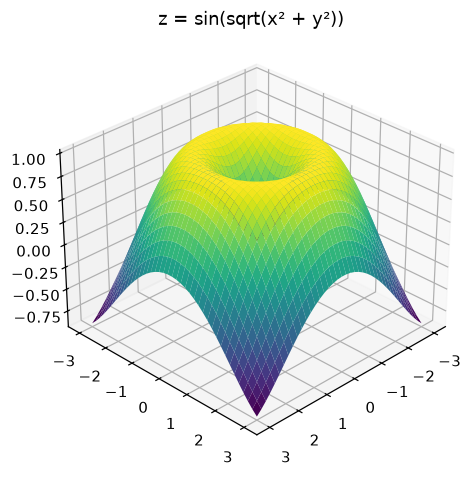
View lesson →Draw 3D surfaces and wireframes with projection="3d", plot_surface and view_init.
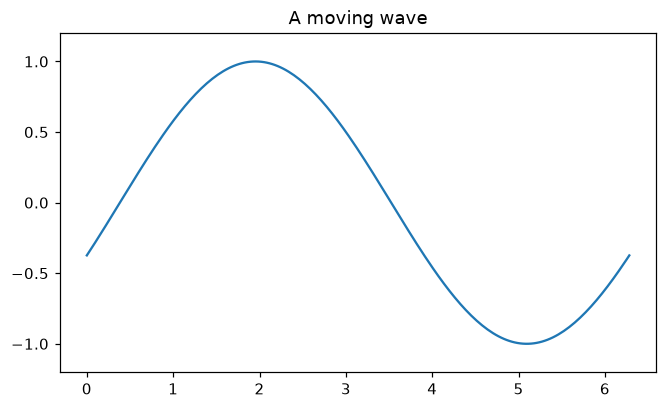
View lesson →Animate a chart frame by frame with FuncAnimation and save it as a GIF.
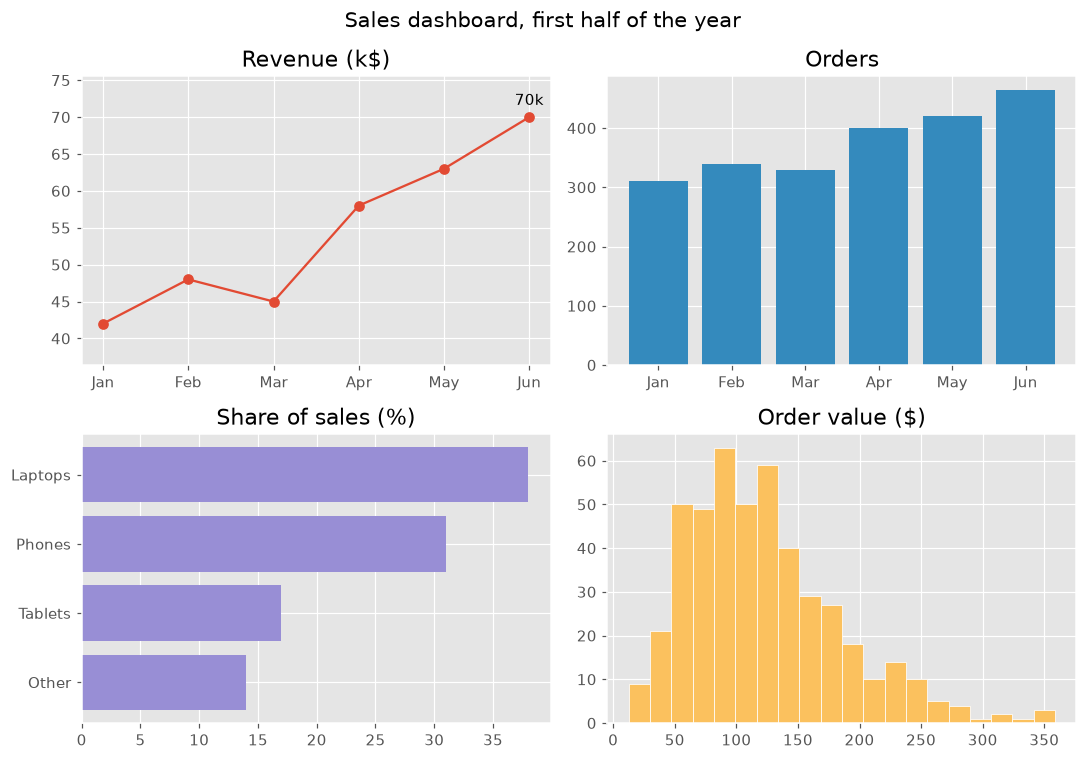
View lesson →Combine line, bar and histogram charts, annotations and a style into a 2 × 2 sales dashboard.
View lesson →