एक फ़िगर में कई चार्ट
plt.subplots(पंक्तियाँ, कॉलम) से चार्ट को ग्रिड में लगाएँ।
परिचय
plt.subplots(rows, cols) एक फ़िगर और Axes का ग्रिड लौटाता है। हर Axes एक अलग चार्ट है, इसलिए आप अपने डेटा के अलग-अलग नज़रिए साथ-साथ रखकर तुलना कर सकते हैं।
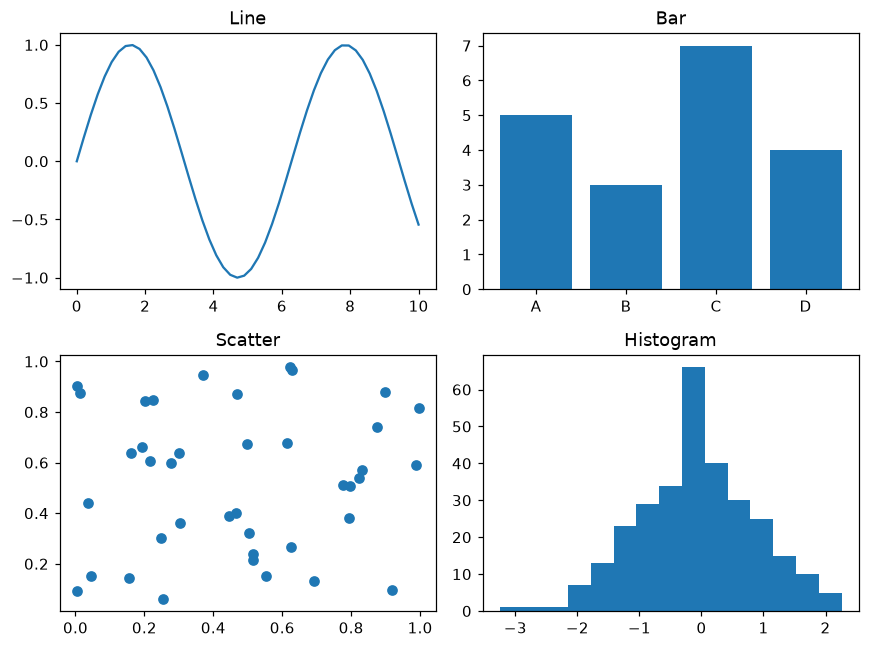
axes एक 2 × 2 ऐरे है, axes[0, 0] ऊपर बाईं ओर का चार्ट है और axes[1, 1] नीचे दाईं ओर का। हर चार्ट का अपना डेटा और टाइटल है। fig.tight_layout दूरी ठीक करता है ताकि टाइटल और लेबल एक-दूसरे पर न चढ़ें।
इंटरैक्टिव विज़ुअलाइज़र
पंक्तियों और कॉलम की संख्या बदलें। ध्यान दें कि एक ही पंक्ति या कॉलम में चार्ट axes[i] से और ग्रिड में axes[पंक्ति, कॉलम] से मिलते हैं।
चलने वाला Matplotlib उदाहरण
Matplotlib
main.py
import matplotlib.pyplot as plt
import numpy as np

rng = np.random.default_rng(7)
x = np.linspace(0, 10, 50)

fig, axes = plt.subplots(2, 2, figsize=(8, 6))
axes[0, 0].plot(x, np.sin(x))
axes[0, 0].set_title("Line")
axes[0, 1].bar(["A", "B", "C", "D"], [5, 3, 7, 4])
axes[0, 1].set_title("Bar")
axes[1, 0].scatter(rng.random(40), rng.random(40))
axes[1, 0].set_title("Scatter")
axes[1, 1].hist(rng.normal(size=300), bins=15)
axes[1, 1].set_title("Histogram")
fig.tight_layout()
plt.show()