प्रोजेक्ट: सेल्स डैशबोर्ड बनाएँ
लाइन, बार, हिस्टोग्राम, एनोटेशन और स्टाइल को मिलाकर 2 × 2 सेल्स डैशबोर्ड बनाएँ।
परिचय
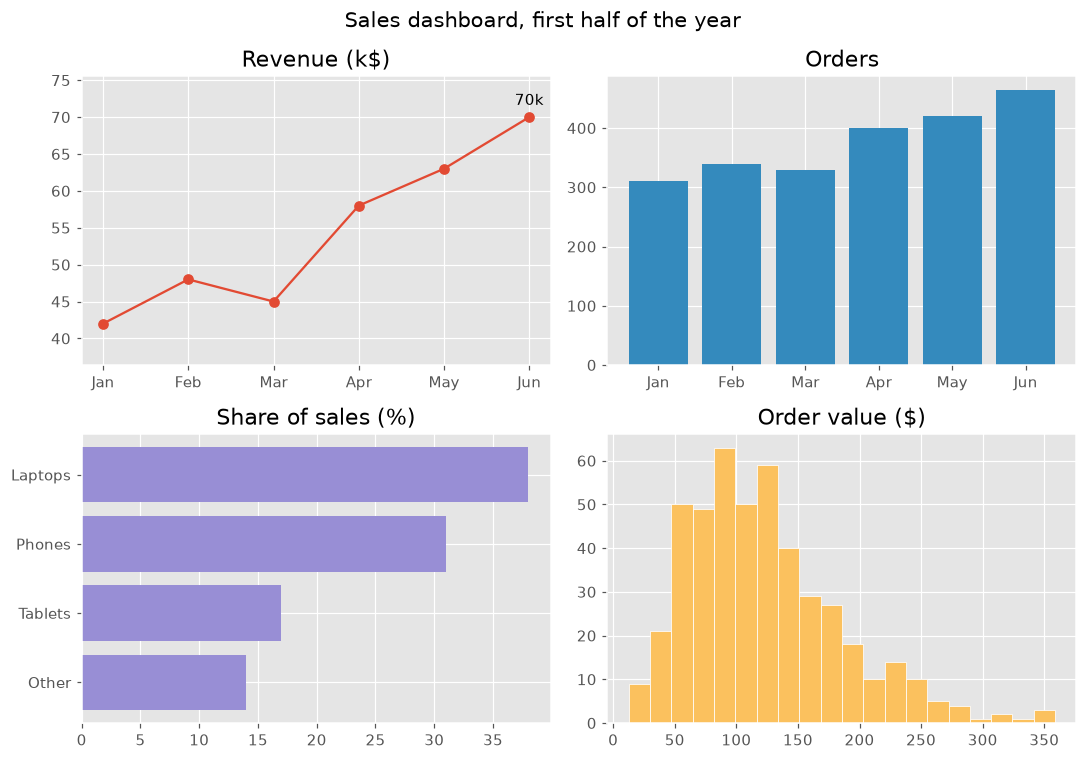
यह प्रोजेक्ट पूरे कोर्स को एक साथ लाता है: एक फ़िगर में चार चार्ट, हर एक उसी सेल्स डेटा के बारे में एक सवाल का जवाब देता है। एक जैसा स्टाइल और साफ़ टाइटल डैशबोर्ड को एक नज़र में पढ़ने लायक बनाते हैं।
plt.style.use पूरे फ़िगर के रंग और फ़ॉन्ट तय करता है। हर पैनल एक सवाल का जवाब देता है: राजस्व कैसे बढ़ा (सबसे अच्छे महीने के एनोटेशन वाली लाइन), कितने ऑर्डर आए (बार), क्या बिकता है (क्रम से लगे हॉरिज़ॉन्टल बार) और ऑर्डर आमतौर पर कितने के होते हैं (हिस्टोग्राम)। color="C1" स्टाइल का दूसरा रंग चुनता है ताकि हर पैनल का अपना रंग हो, और margins लेबल के लिए जगह छोड़ता है। suptitle पूरे फ़िगर को टाइटल देता है और tight_layout पैनलों को ओवरलैप होने से रोकता है। "fivethirtyeight" या "bmh" जैसा कोई और स्टाइल आज़माएँ।
इंटरैक्टिव विज़ुअलाइज़र
पूरे डैशबोर्ड का रूप एक साथ बदलने के लिए स्टाइल बदलें, और किसी पैनल को चुनकर उसे बनाने वाला कोड देखें।
चलने वाला Matplotlib उदाहरण
import matplotlib.pyplot as plt
import numpy as np

plt.style.use("ggplot")
months = ["Jan", "Feb", "Mar", "Apr", "May", "Jun"]
revenue = np.array([42, 48, 45, 58, 63, 70])
orders = np.array([310, 340, 330, 400, 420, 465])
products = {"Other": 14, "Tablets": 17, "Phones": 31, "Laptops": 38}
order_values = np.random.default_rng(8).gamma(4, 30, 465)

fig, axes = plt.subplots(2, 2, figsize=(10, 7))
fig.suptitle("Sales dashboard, first half of the year", fontsize=14)

axes[0, 0].plot(months, revenue, marker="o")
best = revenue.argmax()
axes[0, 0].annotate(f"{revenue[best]}k", (best, revenue[best]), xytext=(0, 8), textcoords="offset points", ha="center")
axes[0, 0].margins(y=0.2)
axes[0, 0].set_title("Revenue (k$)")

axes[0, 1].bar(months, orders, color="C1")
axes[0, 1].set_title("Orders")

axes[1, 0].barh(list(products), list(products.values()), color="C2")
axes[1, 0].set_title("Share of sales (%)")

axes[1, 1].hist(order_values, bins=20, color="C4", edgecolor="white")
axes[1, 1].set_title("Order value ($)")

fig.tight_layout()
plt.show()