วาดกราฟจาก DataFrame ของ pandas
เปลี่ยน DataFrame ของ pandas เป็นกราฟด้วย df.plot แล้วปรับแต่งด้วย Matplotlib
บทนำ
pandas มี Matplotlib ในตัว df.plot วาดกราฟจาก DataFrame ได้ทันทีและใช้ชื่อคอลัมน์เป็นคำอธิบายกราฟ โดยคืนค่า Axes ของ Matplotlib สิ่งที่คุณเรียนมาเรื่องชื่อกราฟ ป้าย และสไตล์จึงยังใช้ได้ทั้งหมด
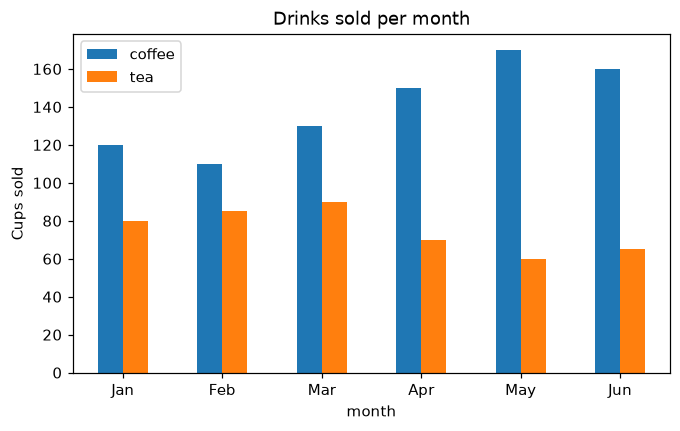
x="month" วางเดือนบนแกน x และ y=[...] เลือกคอลัมน์ที่จะวาด kind เลือกชนิดกราฟ ("line", "bar", "barh", "area" ...) df.plot คืนค่า ax ซึ่งเป็น Axes ปกติของ Matplotlib ax.set_ylabel และ ax.set_title จึงใช้ได้เหมือนเดิม rot=0 ทำให้ชื่อเดือนอยู่แนวนอน และ stacked=True จะซ้อนแท่ง
ตัวแสดงภาพแบบโต้ตอบ
เปลี่ยน kind เลือกคอลัมน์ และซ้อนกัน pandas วาดด้วย Matplotlib และคืนค่า Axes ที่ปรับแต่งต่อได้
ตัวอย่าง Matplotlib ที่รันได้
Matplotlib
main.py
import matplotlib.pyplot as plt
import pandas as pd

df = pd.DataFrame({
    "month": ["Jan", "Feb", "Mar", "Apr", "May", "Jun"],
    "coffee": [120, 110, 130, 150, 170, 160],
    "tea": [80, 85, 90, 70, 60, 65],
})

ax = df.plot(x="month", y=["coffee", "tea"], kind="bar", rot=0, figsize=(7, 4))
ax.set_ylabel("Cups sold")
ax.set_title("Drinks sold per month")
plt.show()