โปรเจกต์: สร้างแดชบอร์ดยอดขาย
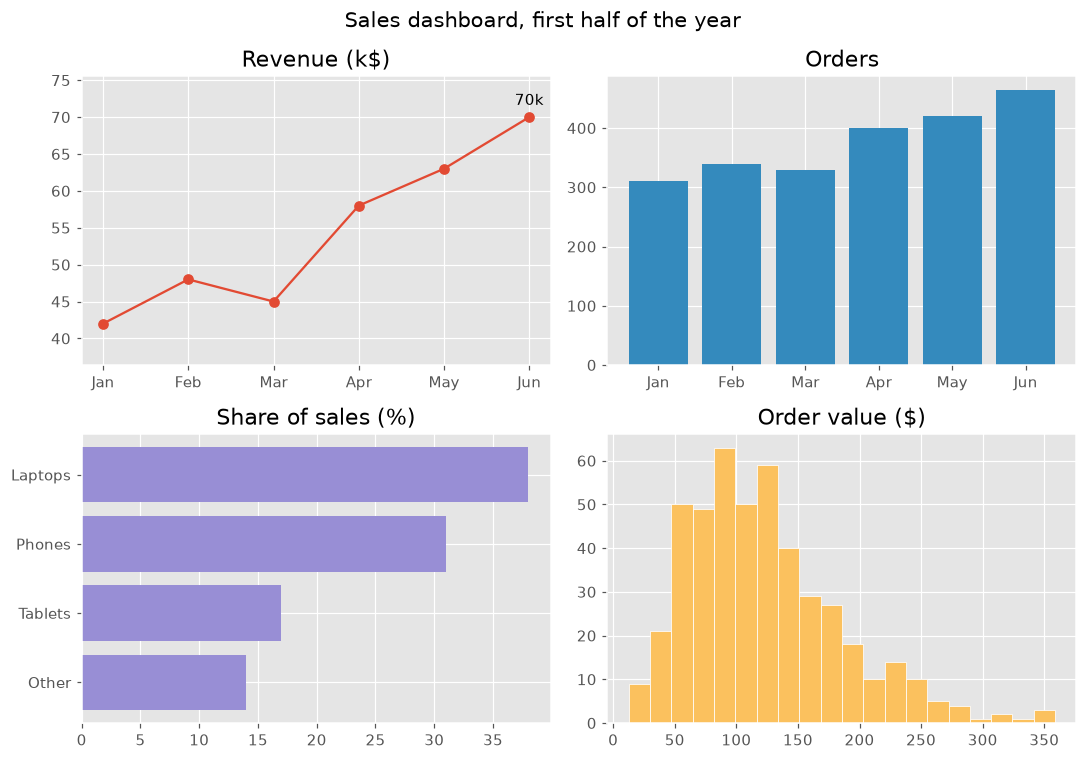
รวมกราฟเส้น กราฟแท่ง ฮิสโทแกรม คำอธิบายประกอบ และสไตล์เป็นแดชบอร์ดยอดขายขนาด 2 × 2
บทนำ
โปรเจกต์นี้รวมทุกอย่างในคอร์ส สี่กราฟในรูปเดียว แต่ละกราฟตอบคำถามหนึ่งข้อเกี่ยวกับข้อมูลยอดขายชุดเดียวกัน สไตล์ที่เหมือนกันและชื่อกราฟที่ชัดเจนทำให้อ่านแดชบอร์ดได้ในแวบเดียว
plt.style.use กำหนดสีและฟอนต์ของทั้งรูป แต่ละแผงตอบคำถามหนึ่งข้อ รายได้โตอย่างไร (เส้นพร้อมคำอธิบายเดือนที่ดีที่สุด) มีคำสั่งซื้อกี่รายการ (แท่ง) อะไรขายดี (แท่งแนวนอนที่เรียงแล้ว) และคำสั่งซื้อมักมีมูลค่าเท่าไร (ฮิสโทแกรม) color="C1" เลือกสีที่สองของสไตล์ให้แต่ละแผงมีสีของตัวเอง และ margins เว้นที่ให้ป้าย suptitle ตั้งชื่อทั้งรูป และ tight_layout ป้องกันไม่ให้แผงซ้อนกัน ลองสไตล์อื่น เช่น "fivethirtyeight" หรือ "bmh"
ตัวแสดงภาพแบบโต้ตอบ
เปลี่ยนสไตล์เพื่อเปลี่ยนหน้าตาแดชบอร์ดทั้งหมดในครั้งเดียว และเลือกแผงเพื่อดูโค้ดที่วาดแผงนั้น
ตัวอย่าง Matplotlib ที่รันได้
import matplotlib.pyplot as plt
import numpy as np

plt.style.use("ggplot")
months = ["Jan", "Feb", "Mar", "Apr", "May", "Jun"]
revenue = np.array([42, 48, 45, 58, 63, 70])
orders = np.array([310, 340, 330, 400, 420, 465])
products = {"Other": 14, "Tablets": 17, "Phones": 31, "Laptops": 38}
order_values = np.random.default_rng(8).gamma(4, 30, 465)

fig, axes = plt.subplots(2, 2, figsize=(10, 7))
fig.suptitle("Sales dashboard, first half of the year", fontsize=14)

axes[0, 0].plot(months, revenue, marker="o")
best = revenue.argmax()
axes[0, 0].annotate(f"{revenue[best]}k", (best, revenue[best]), xytext=(0, 8), textcoords="offset points", ha="center")
axes[0, 0].margins(y=0.2)
axes[0, 0].set_title("Revenue (k$)")

axes[0, 1].bar(months, orders, color="C1")
axes[0, 1].set_title("Orders")

axes[1, 0].barh(list(products), list(products.values()), color="C2")
axes[1, 0].set_title("Share of sales (%)")

axes[1, 1].hist(order_values, bins=20, color="C4", edgecolor="white")
axes[1, 1].set_title("Order value ($)")

fig.tight_layout()
plt.show()