แอนิเมชันด้วย FuncAnimation
ทำให้กราฟเคลื่อนไหวทีละเฟรมด้วย FuncAnimation และบันทึกเป็น GIF
บทนำ
แอนิเมชันคือกราฟที่ถูกวาดใหม่หลายครั้ง FuncAnimation เรียกฟังก์ชัน update ของคุณหนึ่งครั้งต่อเฟรม ฟังก์ชันนี้เปลี่ยนข้อมูลของเส้นที่มีอยู่แทนการวาดกราฟใหม่ จึงทำงานได้เร็ว
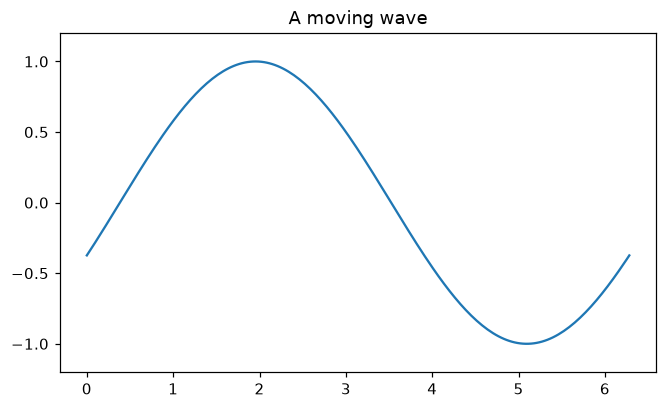
ax.plot คืนค่าลิสต์ของเส้น และ line, = ดึงเส้นเดียวที่มีออกมา update(frame) รับค่า 0, 1, 2 ... แล้วเลื่อนคลื่นไปทีละนิดด้วย set_ydata frames คือจำนวนเฟรม และ interval คือเวลาระหว่างเฟรมเป็นมิลลิวินาที animation.save เขียนไฟล์ GIF ด้วย PillowWriter ในตัวแก้ไขออนไลน์ ไฟล์ GIF จะปรากฏใน workspace และ plt.show() แสดงเฟรมสุดท้าย
ตัวแสดงภาพแบบโต้ตอบ
กด Play ลากแถบ frame และเปลี่ยนจำนวนเฟรมกับช่วงเวลา บรรทัดที่ไฮไลต์จะทำงานหนึ่งครั้งต่อเฟรม
ตัวอย่าง Matplotlib ที่รันได้
Matplotlib
main.py
import matplotlib.pyplot as plt
import numpy as np
from matplotlib.animation import FuncAnimation, PillowWriter

x = np.linspace(0, 2 * np.pi, 200)
fig, ax = plt.subplots(figsize=(7, 4))
line, = ax.plot(x, np.sin(x))
ax.set_ylim(-1.2, 1.2)
ax.set_title("A moving wave")

def update(frame):
    line.set_ydata(np.sin(x + frame / 10))
    return line,

animation = FuncAnimation(fig, update, frames=60, interval=50)
animation.save("wave.gif", writer=PillowWriter(fps=20))
print("Saved wave.gif")
plt.show()