산점도
ax.scatter로 두 변수의 관계를 보여 줍니다.
소개
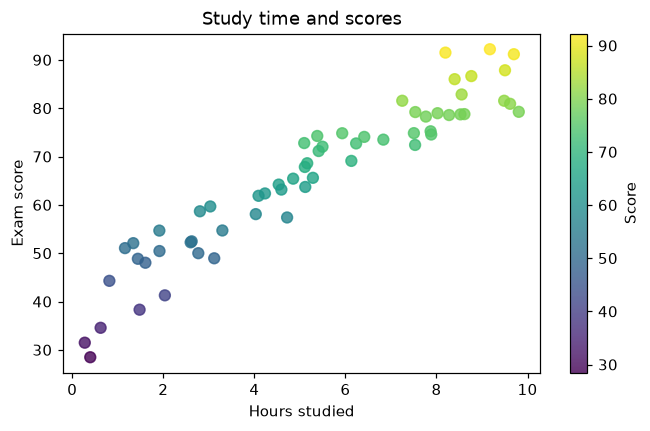
산점도는 관측값마다 점 하나를 그려서 두 값이 함께 변하는지 보여 줍니다. 색과 크기로 세 번째 값도 나타낼 수 있습니다.
(hours, score) 쌍이 각각 하나의 점이 됩니다. c=는 컬러맵 cmap으로 점수에 따라 점에 색을 칠하고, fig.colorbar는 색 척도를 추가합니다. alpha는 겹친 점도 보이게 합니다. 오른쪽 위로 향하는 추세는 공부를 많이 할수록 점수가 높아지는 경향을 보여 줍니다.
인터랙티브 시각화
점과 노이즈를 늘려 보세요. 노이즈가 적으면 점들이 한 줄로 늘어서고, 많으면 추세를 알아보기 어렵습니다.
실행 가능한 Matplotlib 예제
Matplotlib
main.py
import matplotlib.pyplot as plt
import numpy as np

rng = np.random.default_rng(1)
hours = rng.uniform(0, 10, 60)
score = 40 + 5 * hours + rng.normal(0, 6, 60)

fig, ax = plt.subplots(figsize=(7, 4))
points = ax.scatter(hours, score, c=score, cmap="viridis", s=50, alpha=0.8)
fig.colorbar(points, label="Score")
ax.set_xlabel("Hours studied")
ax.set_ylabel("Exam score")
ax.set_title("Study time and scores")
plt.show()