積み上げ棒グラフと面グラフ
積み上げ棒 (bottom=) と ax.stackplot で、部分が時間とともにどう合計になるかを示します。
はじめに
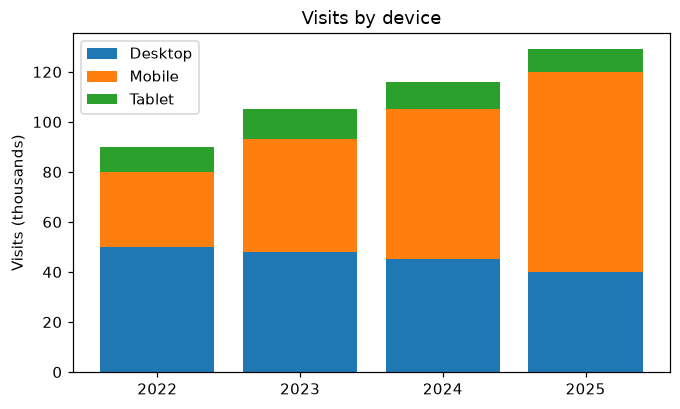
複数の系列の合計に意味があるときは、積み上げて描きます。各棒は前の棒が終わったところから始まるので、全体の高さが合計、色ごとの部分が各系列になります。ax.stackplot は同じことを塗りつぶした面で行います。
bottom= は各 ax.bar の呼び出しに棒の始まる位置を伝えます。mobile は desktop の上から、tablet は両方の上から始まります。NumPy 配列を使うと desktop + mobile で年ごとに値を足せます。各棒の高さはその年の訪問数の合計で、凡例で各部分を見分けます。
インタラクティブ ビジュアライザー
積み上げ棒、グループ棒、面グラフを比べ、パーセント表示に切り替えて各デバイスの割合を見てみましょう。
実行できる Matplotlib の例
Matplotlib
main.py
import matplotlib.pyplot as plt
import numpy as np

years = ["2022", "2023", "2024", "2025"]
desktop = np.array([50, 48, 45, 40])
mobile = np.array([30, 45, 60, 80])
tablet = np.array([10, 12, 11, 9])

fig, ax = plt.subplots(figsize=(7, 4))
ax.bar(years, desktop, label="Desktop")
ax.bar(years, mobile, bottom=desktop, label="Mobile")
ax.bar(years, tablet, bottom=desktop + mobile, label="Tablet")
ax.set_ylabel("Visits (thousands)")
ax.set_title("Visits by device")
ax.legend()
plt.show()