pandas の DataFrame を描画する
df.plot で pandas の DataFrame をグラフにし、Matplotlib で調整します。
はじめに
pandas には Matplotlib が組み込まれています。df.plot は DataFrame から直接グラフを描き、列名を凡例に使います。戻り値は Matplotlib の Axes なので、タイトル、ラベル、スタイルについて学んだことがそのまま使えます。
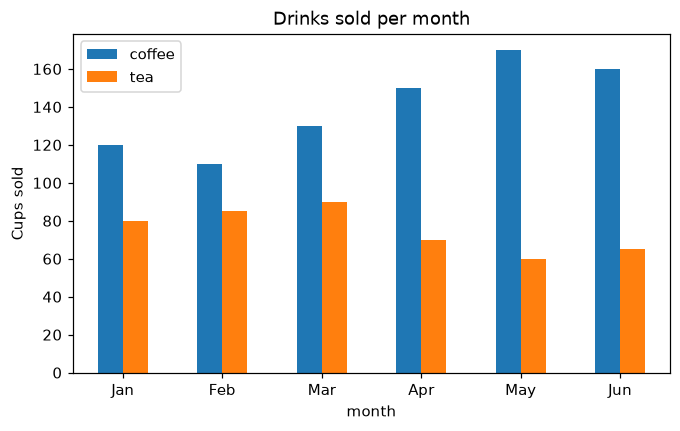
x="month" で月を x 軸に置き、y=[...] で描く列を選び、kind でグラフの種類 ("line"、"bar"、"barh"、"area" など) を選びます。df.plot はいつもの Matplotlib の Axes である ax を返すので、ax.set_ylabel や ax.set_title がそのまま使えます。rot=0 で月名を横向きのままにし、stacked=True にすると棒を積み上げます。
インタラクティブ ビジュアライザー
kind を変え、列を選び、積み上げてみましょう。pandas は Matplotlib で描画し、さらに調整できる Axes を返します。
実行できる Matplotlib の例
Matplotlib
main.py
import matplotlib.pyplot as plt
import pandas as pd

df = pd.DataFrame({
    "month": ["Jan", "Feb", "Mar", "Apr", "May", "Jun"],
    "coffee": [120, 110, 130, 150, 170, 160],
    "tea": [80, 85, 90, 70, 60, 65],
})

ax = df.plot(x="month", y=["coffee", "tea"], kind="bar", rot=0, figsize=(7, 4))
ax.set_ylabel("Cups sold")
ax.set_title("Drinks sold per month")
plt.show()