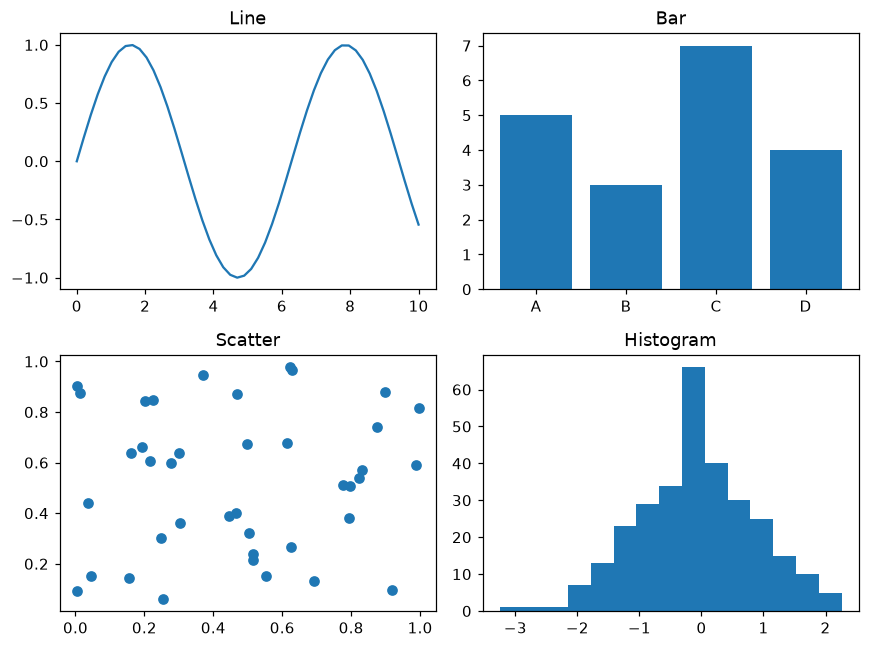
1つの図に複数のグラフ
plt.subplots(行, 列) でグラフをグリッド状に並べます。
はじめに
plt.subplots(rows, cols) は図と Axes のグリッドを返します。各 Axes は独立したグラフなので、データのさまざまな見方を並べて比べられます。
axes は 2 × 2 の配列で、axes[0, 0] が左上、axes[1, 1] が右下のグラフです。それぞれに別のデータとタイトルを設定します。fig.tight_layout はタイトルやラベルが重ならないよう間隔を調整します。
インタラクティブ ビジュアライザー
行と列の数を変えてみましょう。1行または1列のときは axes[i]、グリッドのときは axes[行, 列] で各グラフを指定する点に注目してください。
実行できる Matplotlib の例
Matplotlib
main.py
import matplotlib.pyplot as plt
import numpy as np

rng = np.random.default_rng(7)
x = np.linspace(0, 10, 50)

fig, axes = plt.subplots(2, 2, figsize=(8, 6))
axes[0, 0].plot(x, np.sin(x))
axes[0, 0].set_title("Line")
axes[0, 1].bar(["A", "B", "C", "D"], [5, 3, 7, 4])
axes[0, 1].set_title("Bar")
axes[1, 0].scatter(rng.random(40), rng.random(40))
axes[1, 0].set_title("Scatter")
axes[1, 1].hist(rng.normal(size=300), bins=15)
axes[1, 1].set_title("Histogram")
fig.tight_layout()
plt.show()