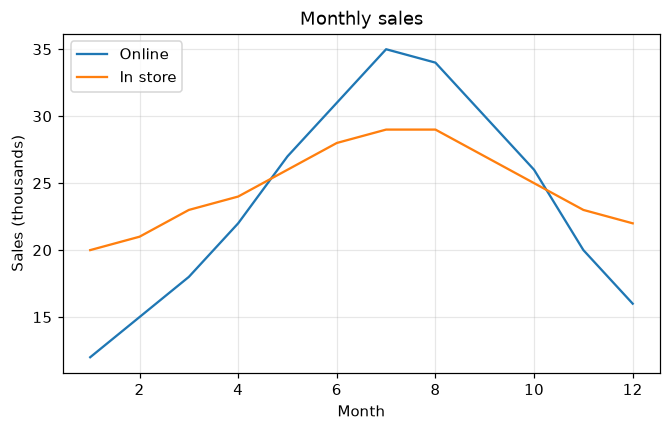
タイトル、軸ラベル、凡例
タイトル、軸ラベル、凡例、グリッドでグラフをわかりやすくします。
はじめに
グラフは何を表しているかが伝わって初めて役に立ちます。各線にラベルを付け、軸ラベル、タイトル、そして各線と名前を対応させる凡例を追加しましょう。
label= で各線に名前を付け、ax.legend がその名前を枠の中に表示します。loc で位置を選びます。set_xlabel と set_ylabel は軸を説明し、ax.grid は薄い補助線を追加します (alpha で淡くします)。
インタラクティブ ビジュアライザー
各要素をオン・オフして、それがないとグラフがどう見えるかを確かめ、凡例をデータを隠さない隅に移しましょう。
実行できる Matplotlib の例
Matplotlib
main.py
import matplotlib.pyplot as plt
import numpy as np

months = np.arange(1, 13)
online = [12, 15, 18, 22, 27, 31, 35, 34, 30, 26, 20, 16]
store = [20, 21, 23, 24, 26, 28, 29, 29, 27, 25, 23, 22]

fig, ax = plt.subplots(figsize=(7, 4))
ax.plot(months, online, label="Online")
ax.plot(months, store, label="In store")
ax.set_title("Monthly sales")
ax.set_xlabel("Month")
ax.set_ylabel("Sales (thousands)")
ax.legend(loc="upper left")
ax.grid(True, alpha=0.3)
plt.show()