subplot_mosaic で複雑なレイアウト
plt.subplot_mosaic と幅・高さの比で、大きさの違うグラフを並べた図を作ります。
はじめに
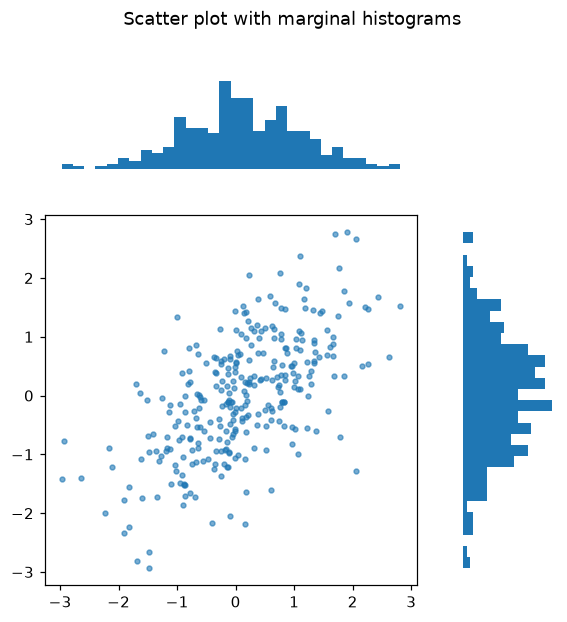
plt.subplots は均等なグリッドを作りますが、実際の図では大きなメイングラフのまわりに小さなグラフを置きたいことがよくあります。plt.subplot_mosaic を使うと、レイアウトを行のリストとして描き、グラフごとに名前を付けられます。
内側のリスト1つが1行、名前1つが1つのグラフです。複数のセルで同じ名前を繰り返すと大きなグラフになり、"." はセルを空けます。axes は辞書なので、axes["main"] が散布図です。gridspec_kw で相対的な大きさを決め、メインの列は右の列の4倍の幅になります。端のヒストグラムは x と y の分布を示します。
インタラクティブ ビジュアライザー
レイアウトを選び、サイズ比をオン・オフしてみましょう。モザイクの名前1つが1つのグラフになります。
実行できる Matplotlib の例
Matplotlib
main.py
import matplotlib.pyplot as plt
import numpy as np

rng = np.random.default_rng(4)
x = rng.normal(size=300)
y = 0.6 * x + rng.normal(scale=0.8, size=300)

fig, axes = plt.subplot_mosaic([["top", "."], ["main", "right"]], figsize=(6, 6),
                               gridspec_kw={"width_ratios": [4, 1], "height_ratios": [1, 4]})
axes["main"].scatter(x, y, s=10, alpha=0.6)
axes["top"].hist(x, bins=30)
axes["right"].hist(y, bins=30, orientation="horizontal")
axes["top"].axis("off")
axes["right"].axis("off")
fig.suptitle("Scatter plot with marginal histograms")
plt.show()