FuncAnimation でアニメーション
FuncAnimation でグラフをフレームごとに動かし、GIF として保存します。
はじめに
アニメーションは何度も描き直されるグラフです。FuncAnimation はフレームごとに update 関数を1回呼びます。この関数は新しいグラフを描かずに既存の線のデータを変えるので、高速に動きます。
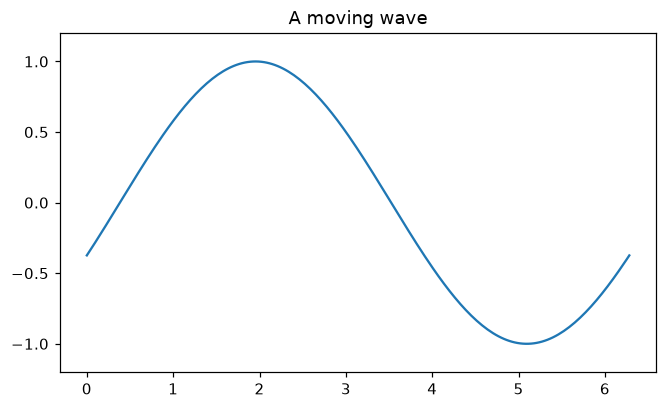
ax.plot は線のリストを返し、line, = でその1本を取り出します。update(frame) は 0、1、2... を受け取り、set_ydata で毎回少しずつ波をずらします。frames はフレーム数、interval はフレーム間の時間 (ミリ秒) です。animation.save は PillowWriter で GIF を書き出します。オンラインエディターでは GIF がワークスペースに表示され、plt.show() は最後のフレームを表示します。
インタラクティブ ビジュアライザー
Play を押し、frame スライダーを動かし、フレーム数と間隔を変えてみましょう。ハイライトされた行がフレームごとに1回実行されます。
実行できる Matplotlib の例
Matplotlib
main.py
import matplotlib.pyplot as plt
import numpy as np
from matplotlib.animation import FuncAnimation, PillowWriter

x = np.linspace(0, 2 * np.pi, 200)
fig, ax = plt.subplots(figsize=(7, 4))
line, = ax.plot(x, np.sin(x))
ax.set_ylim(-1.2, 1.2)
ax.set_title("A moving wave")

def update(frame):
    line.set_ydata(np.sin(x + frame / 10))
    return line,

animation = FuncAnimation(fig, update, frames=60, interval=50)
animation.save("wave.gif", writer=PillowWriter(fps=20))
print("Saved wave.gif")
plt.show()